New Features
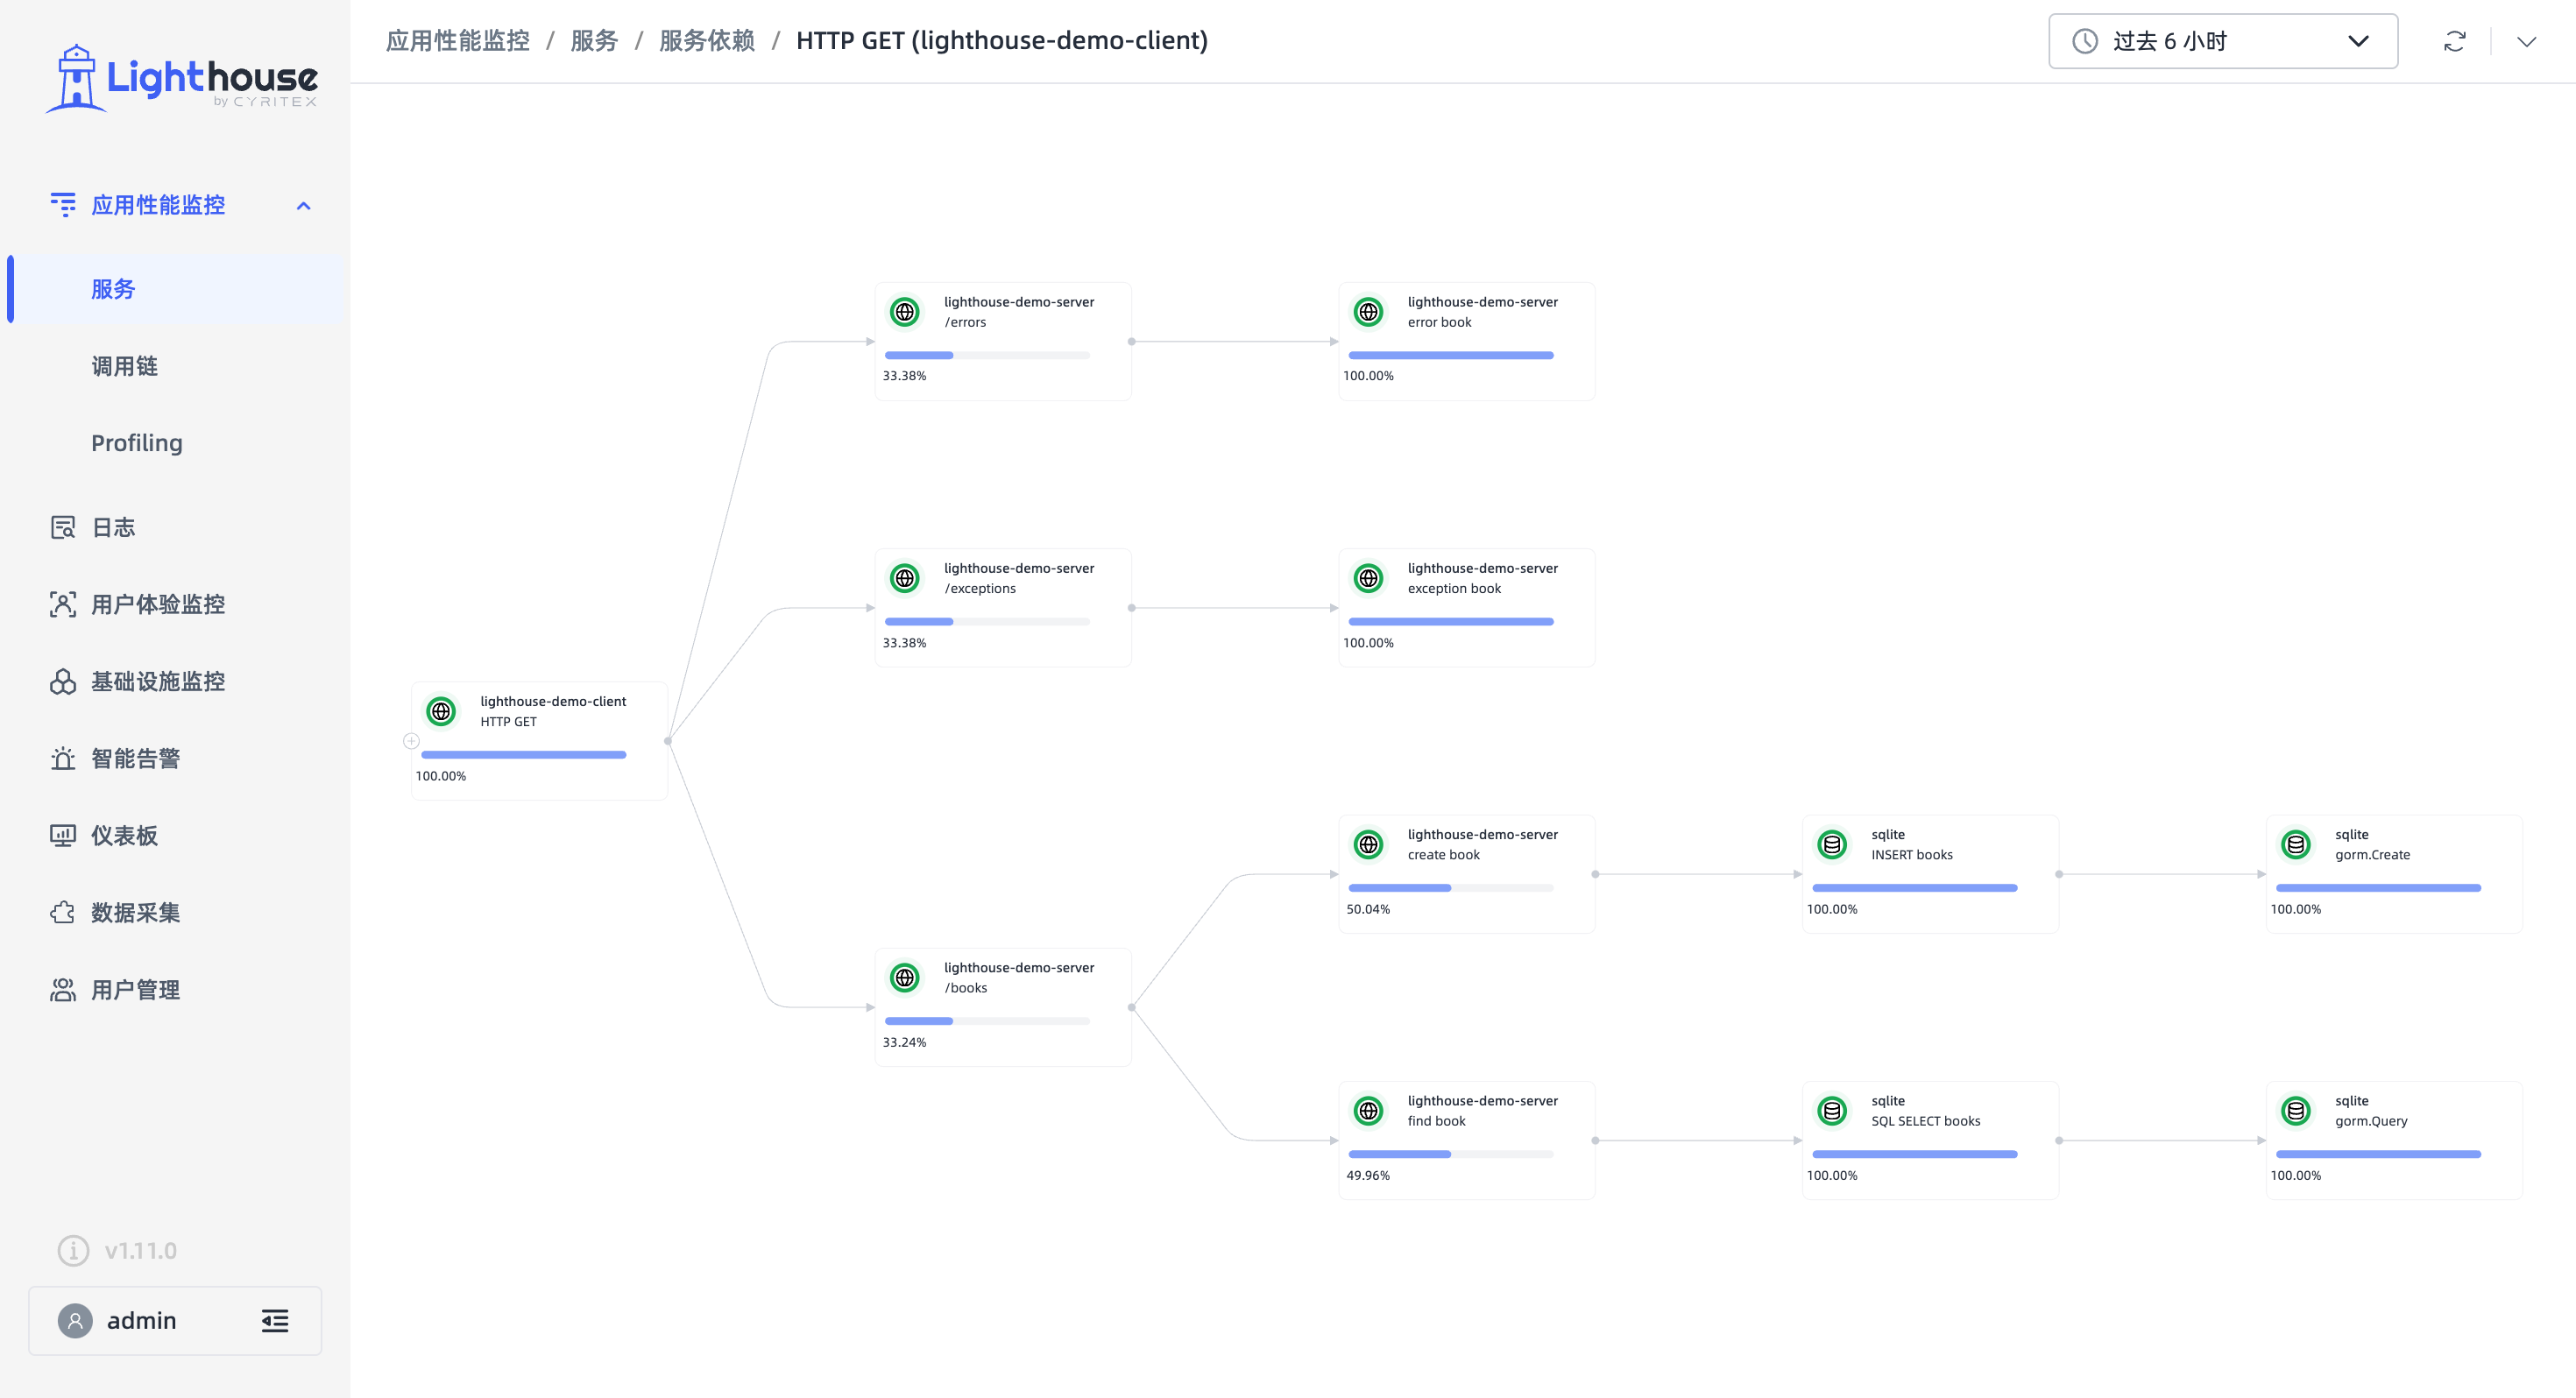
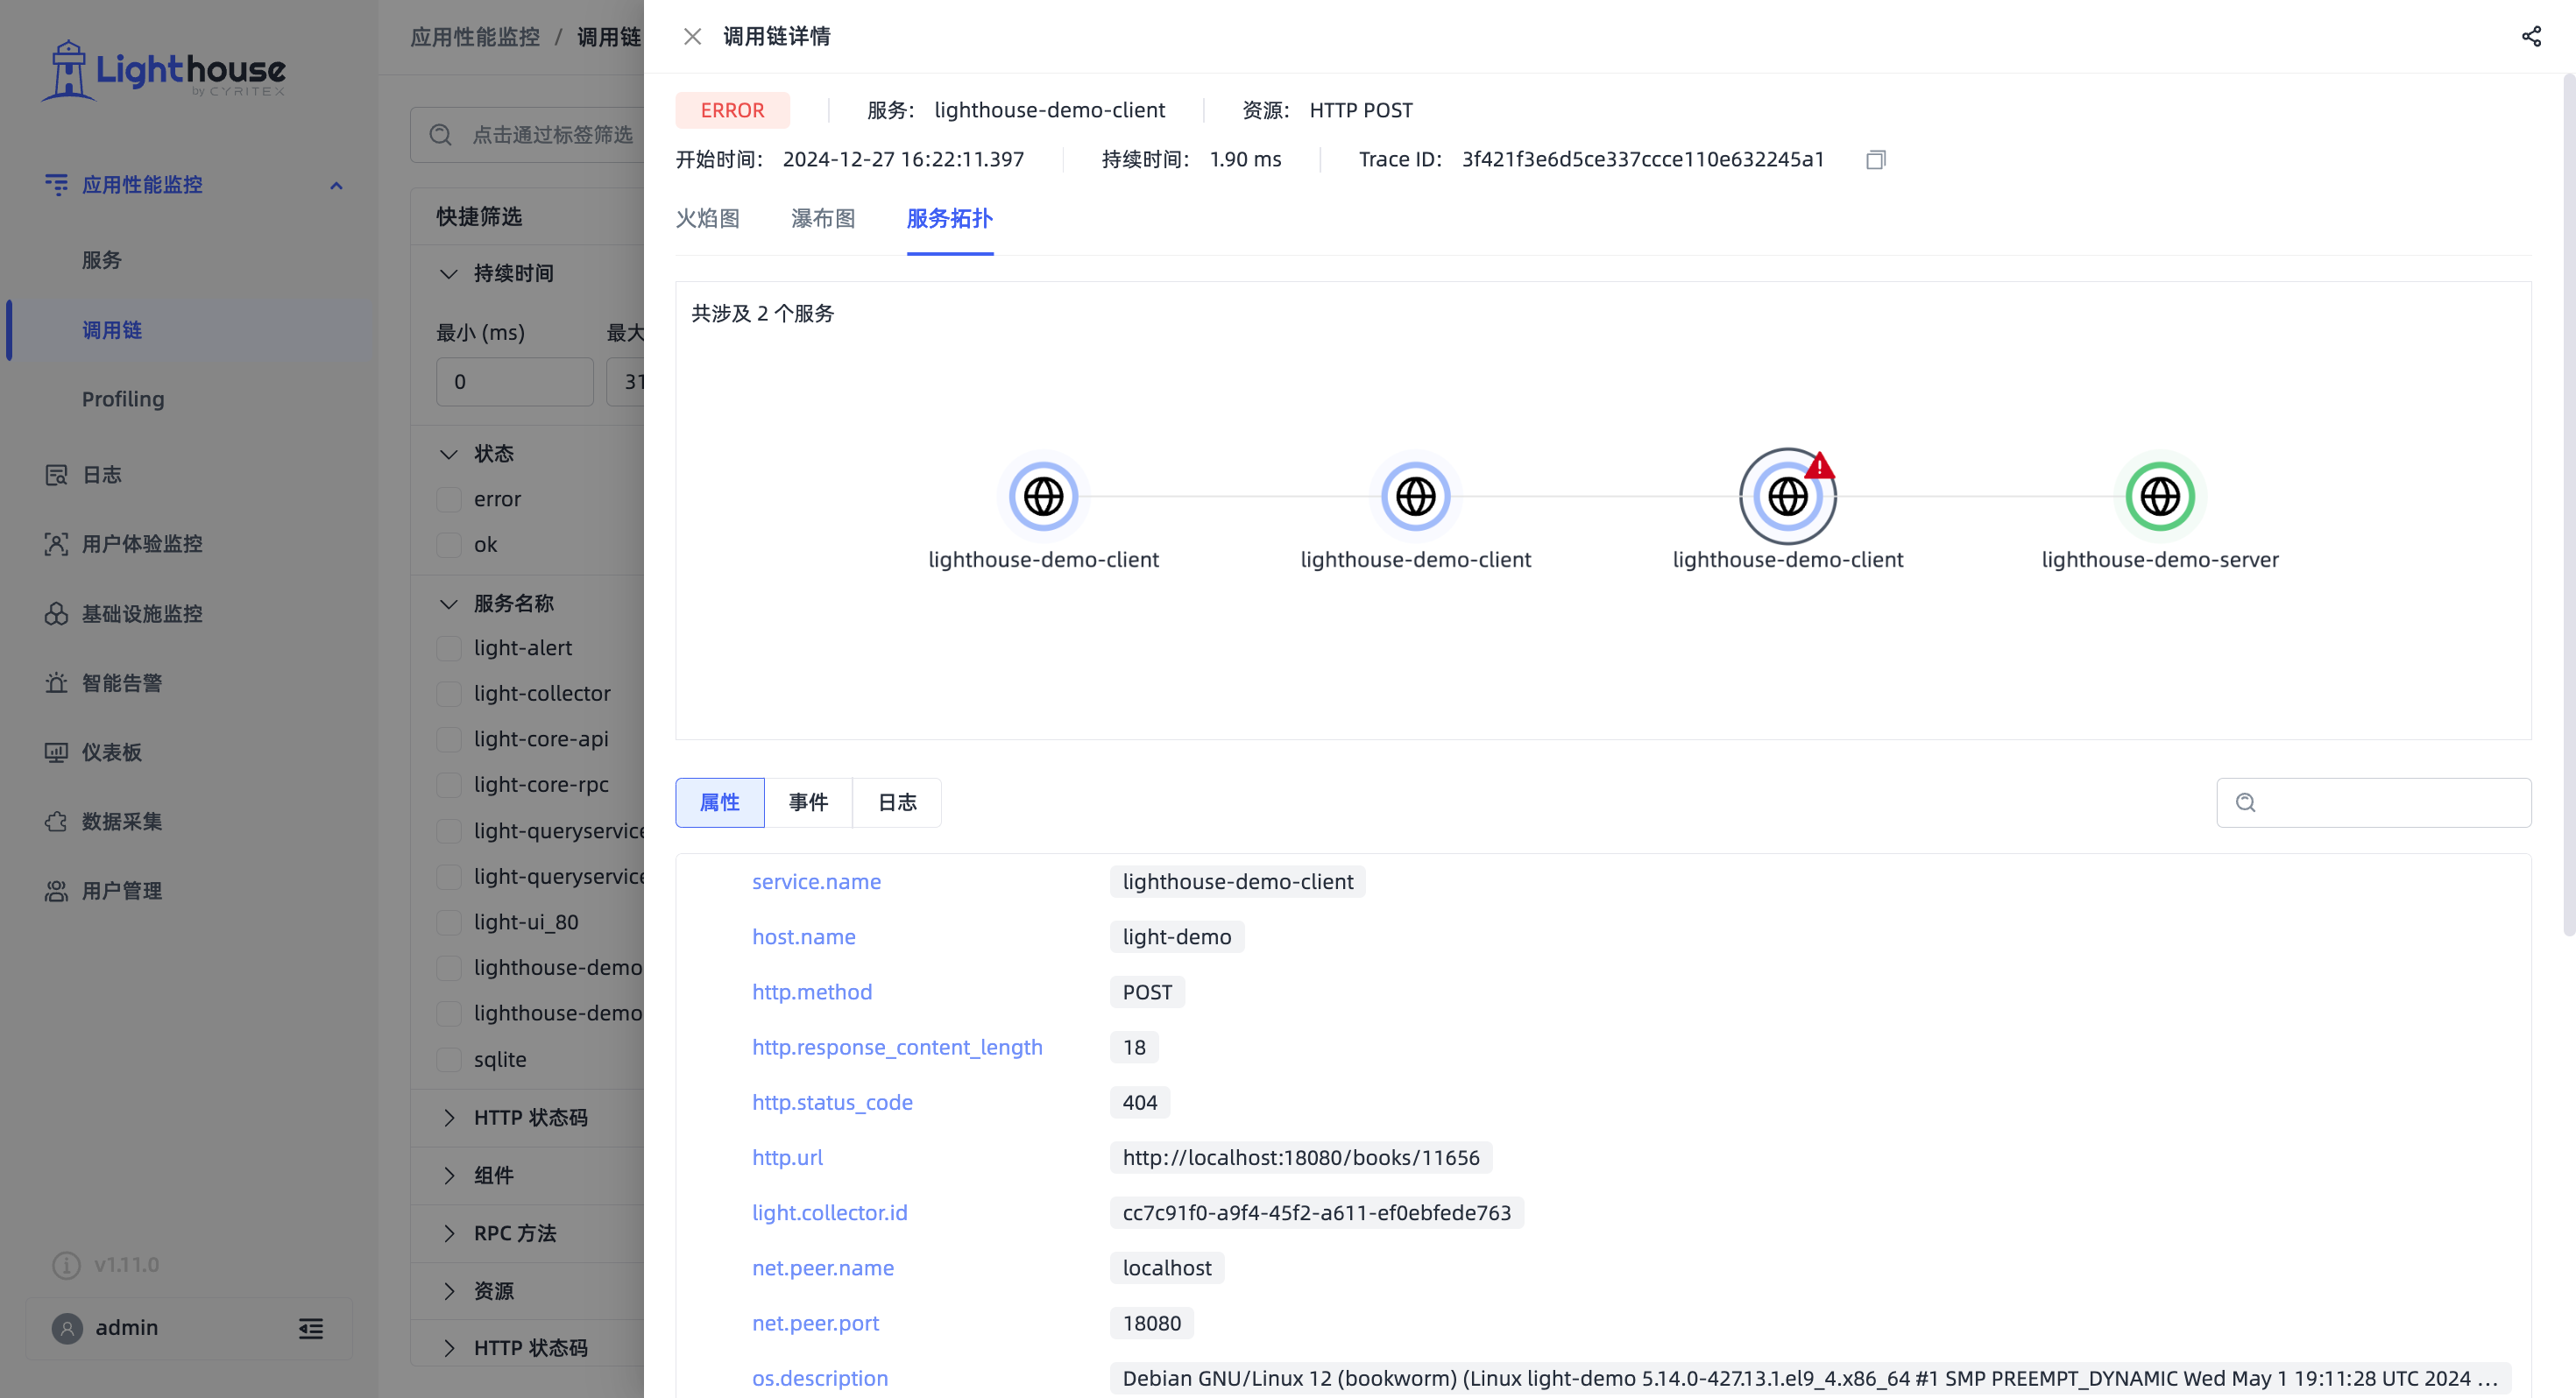
- Added "Service Dependencies" module, displaying collected resource performance data and call relationship topology.
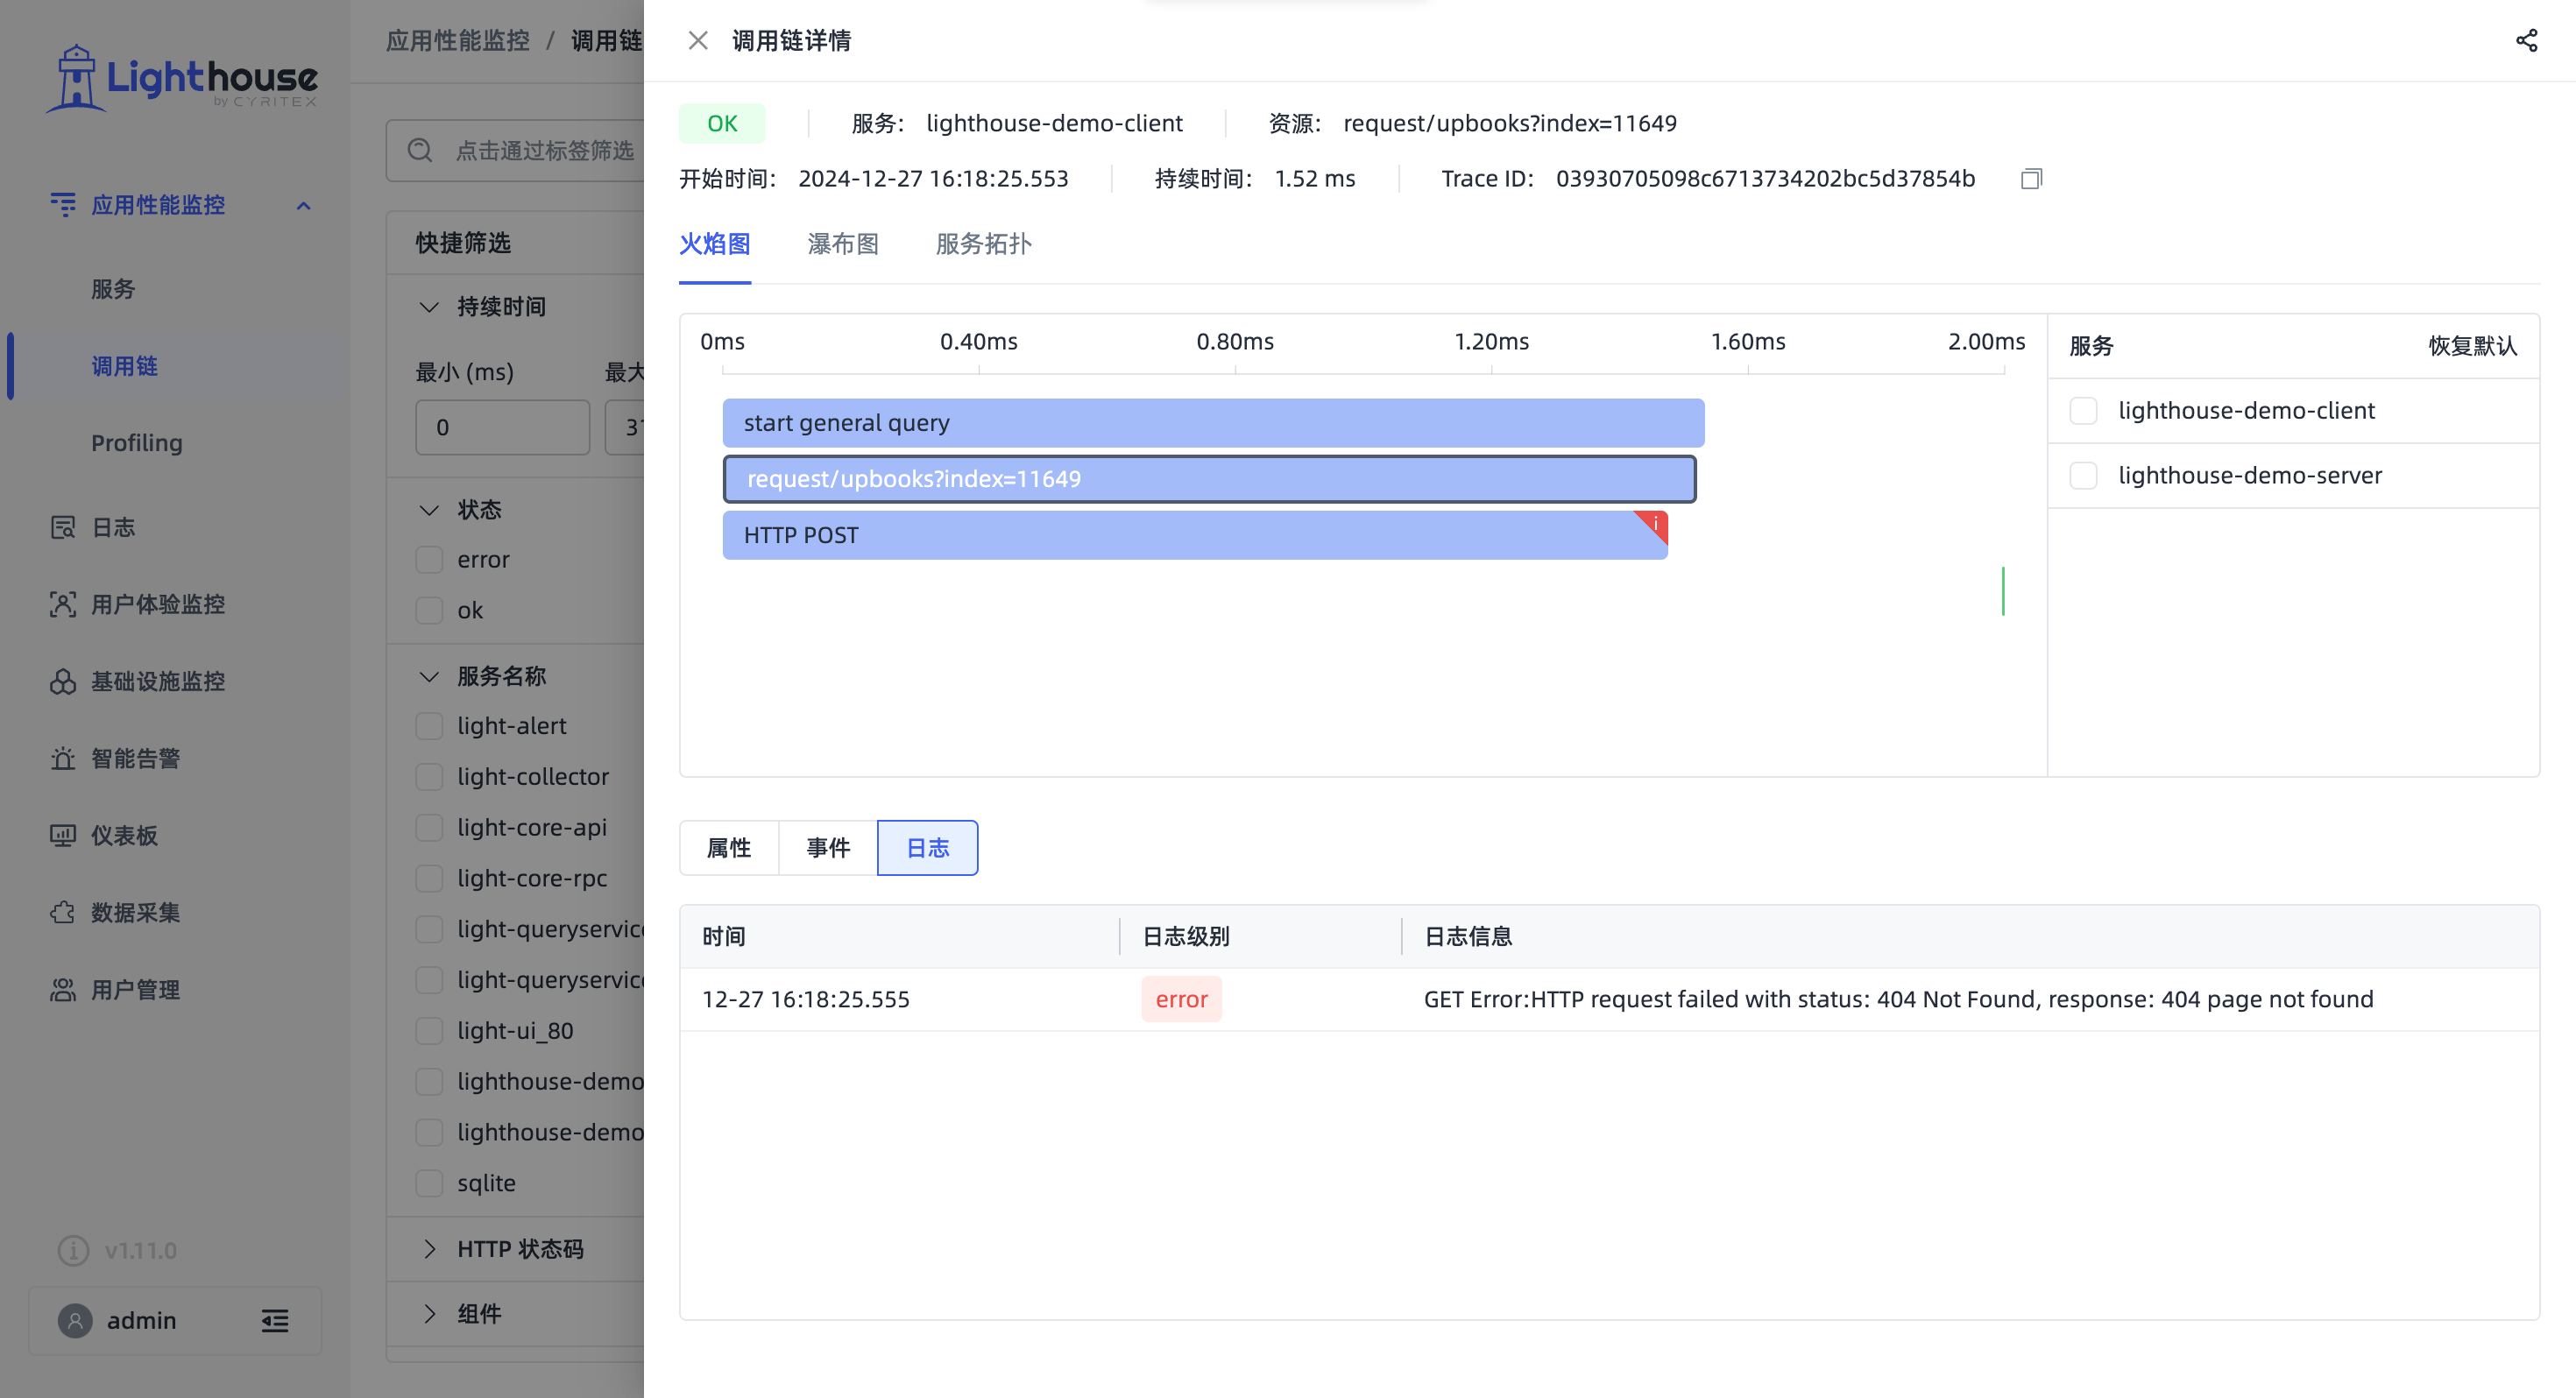
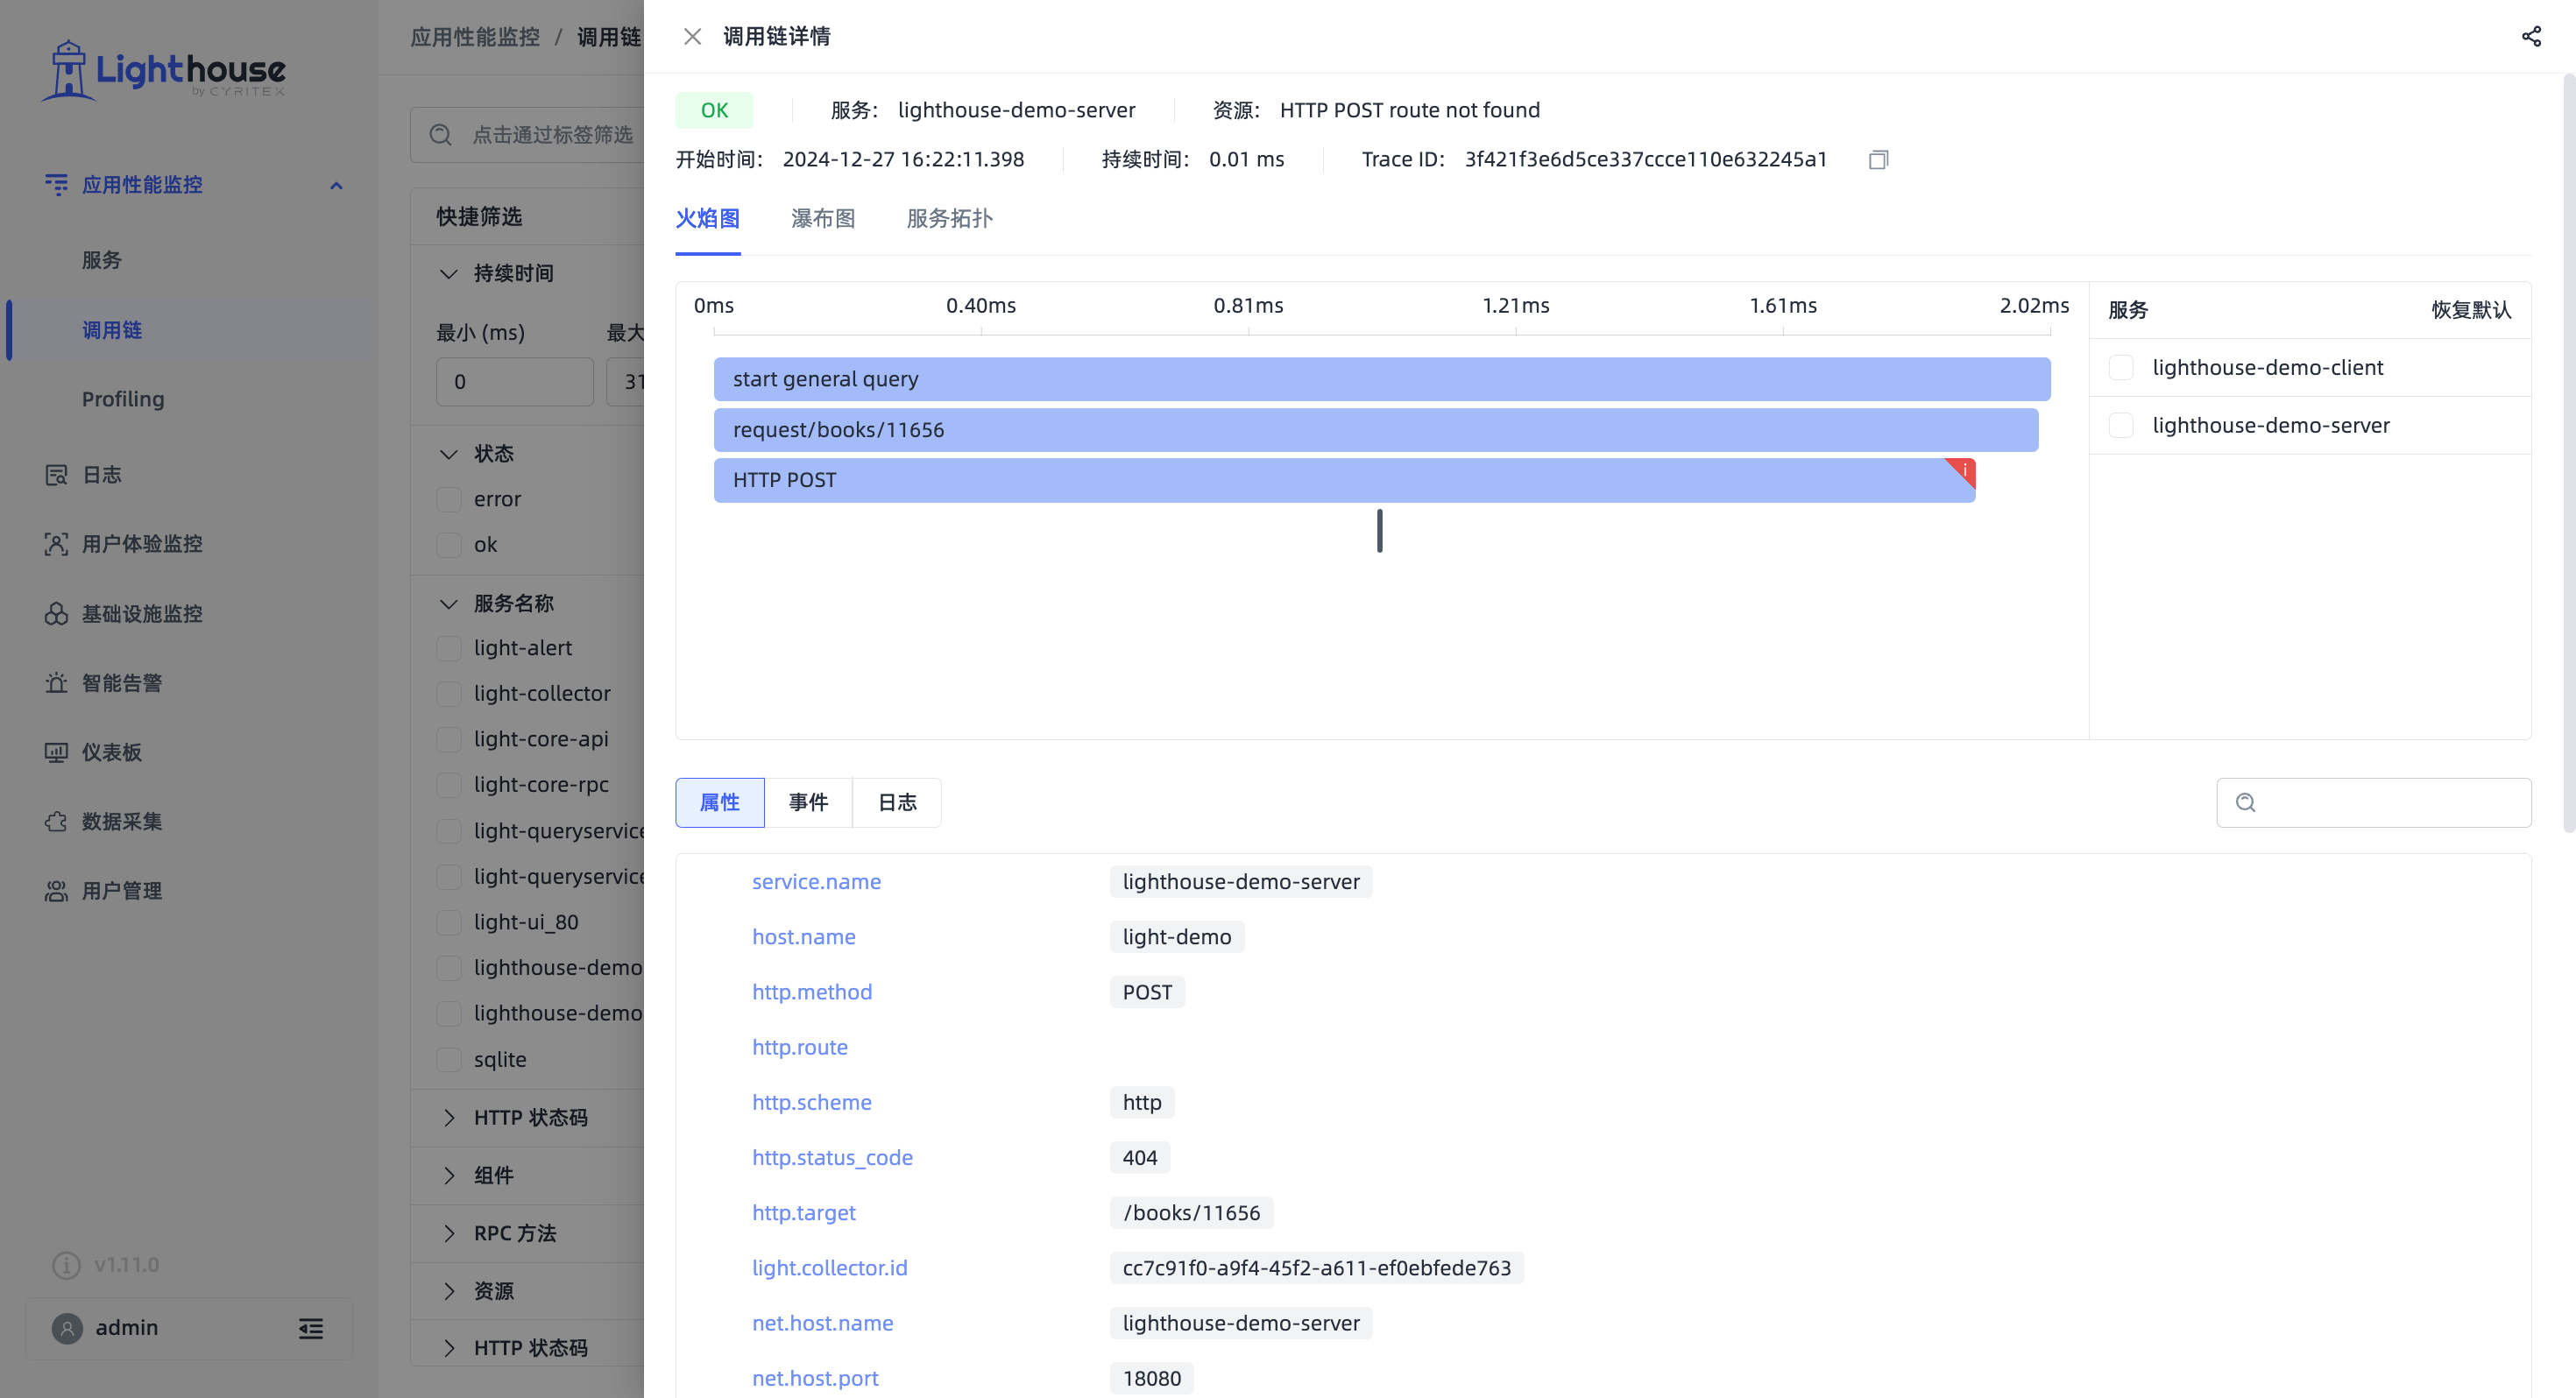
- Added associated log list display in trace detail page.
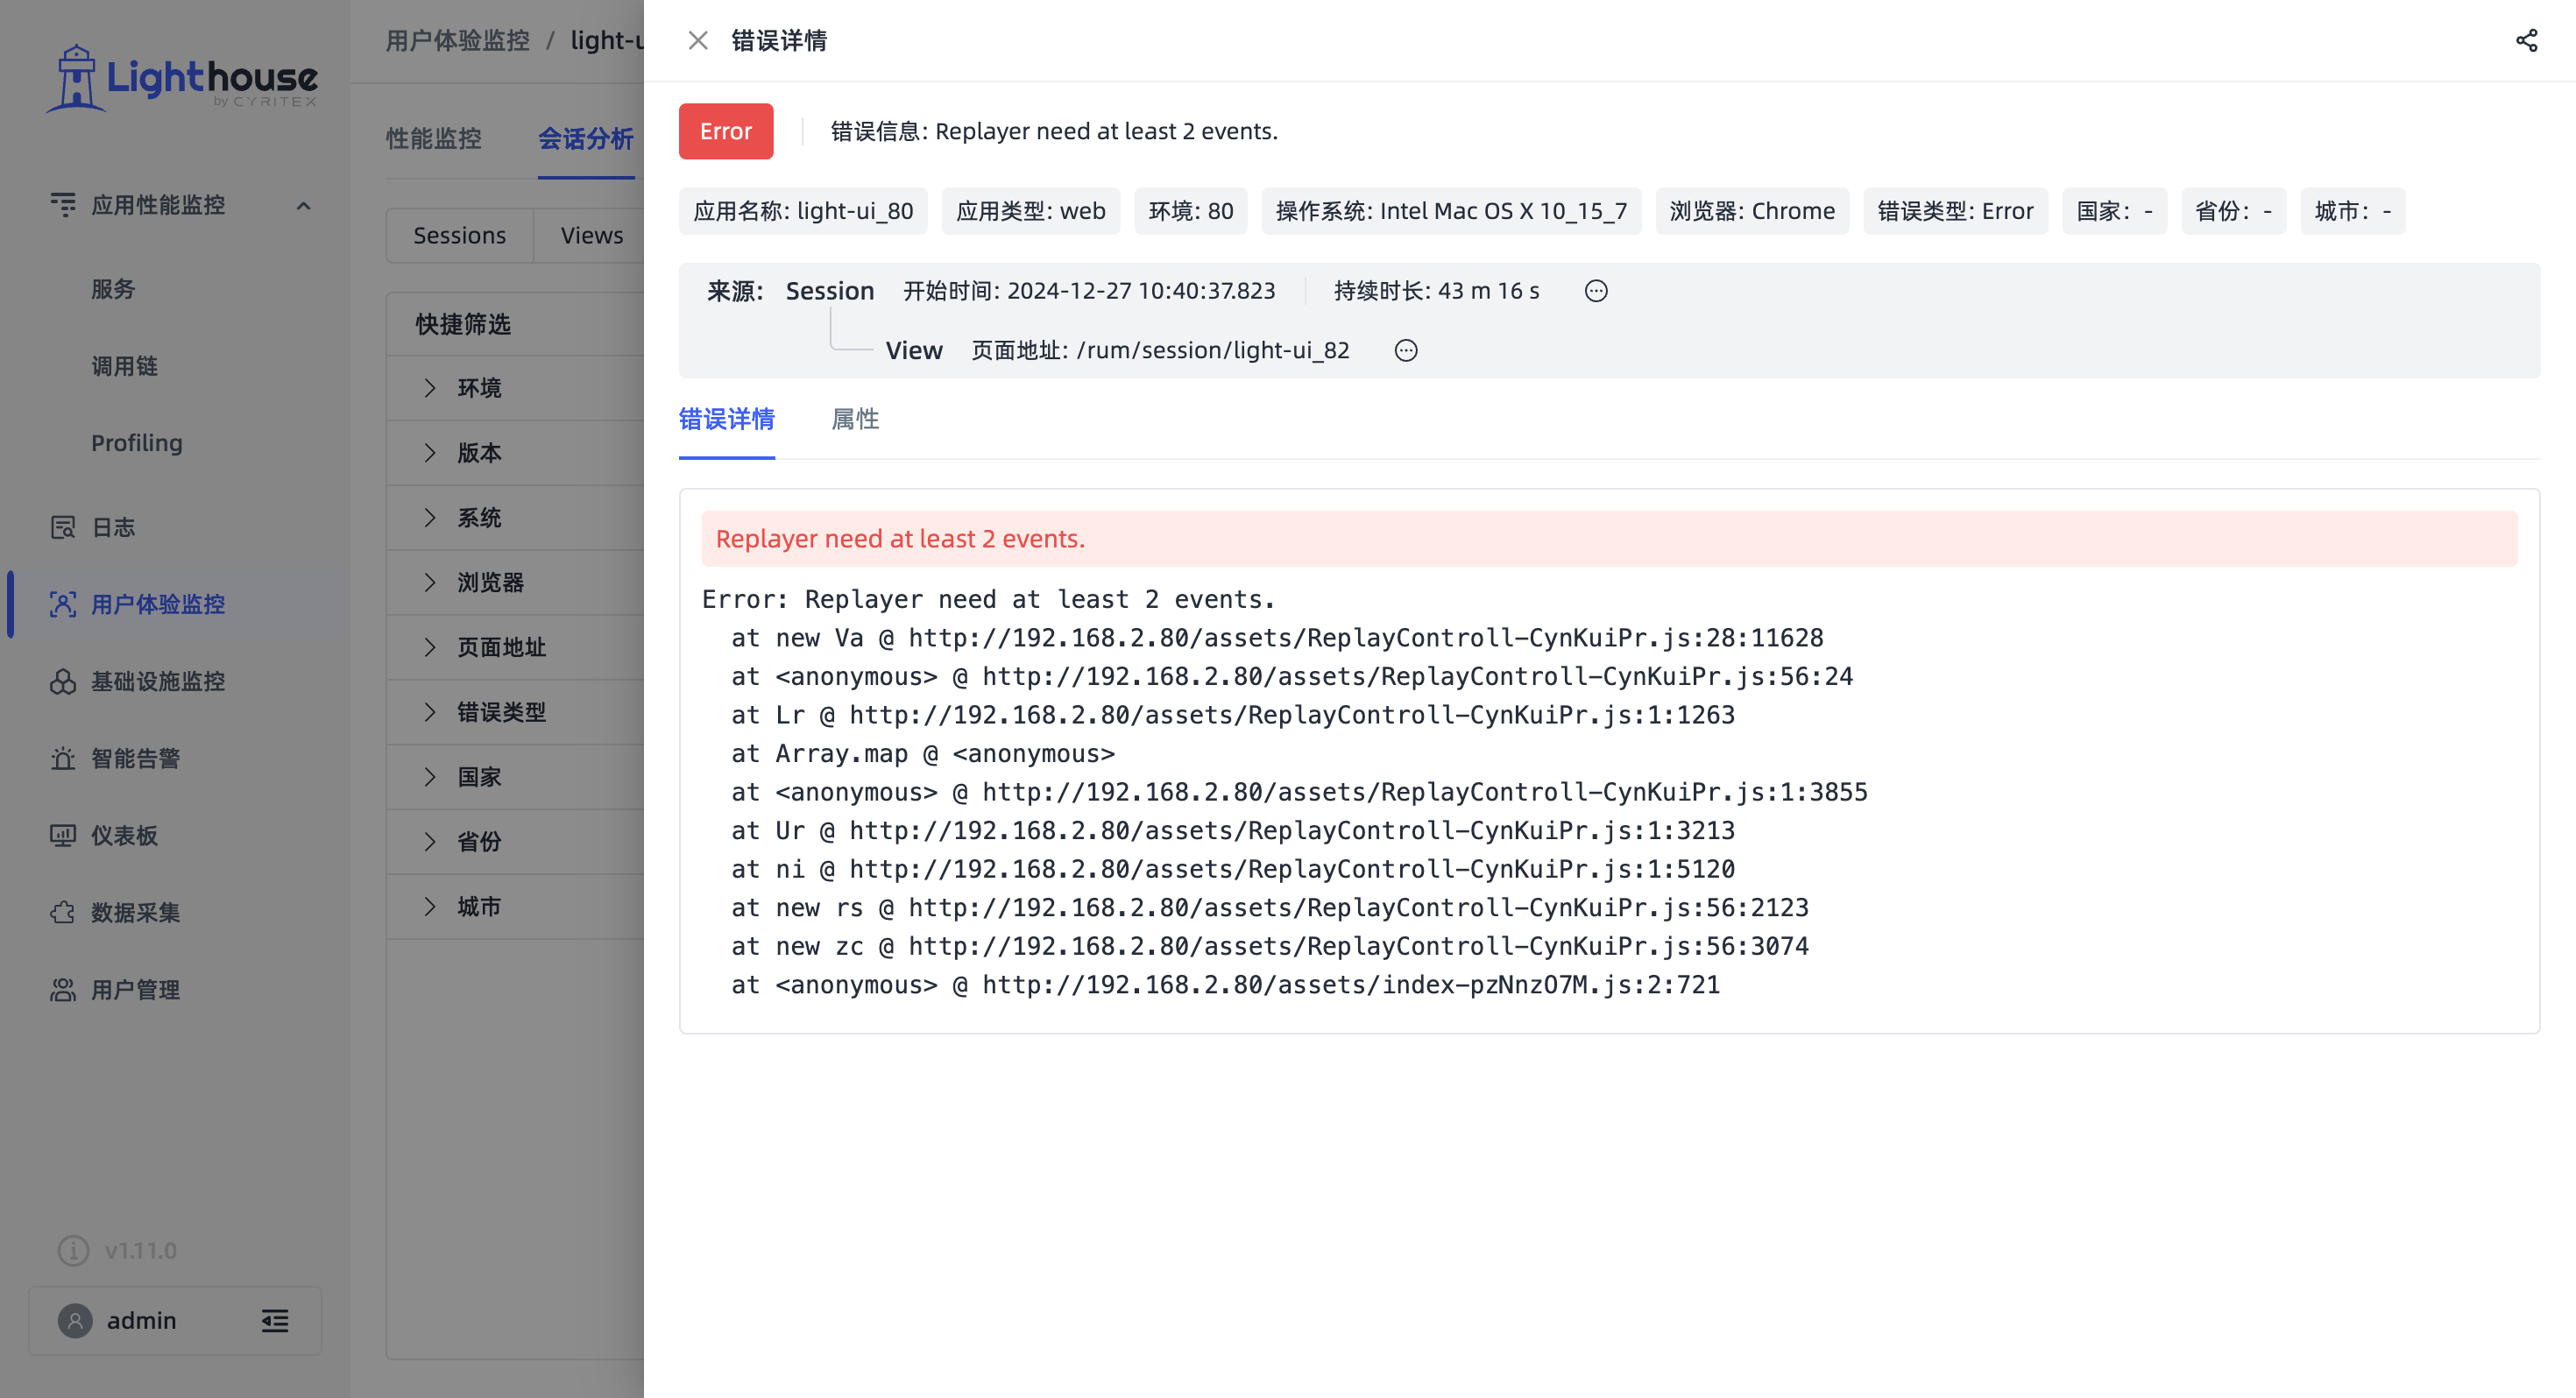
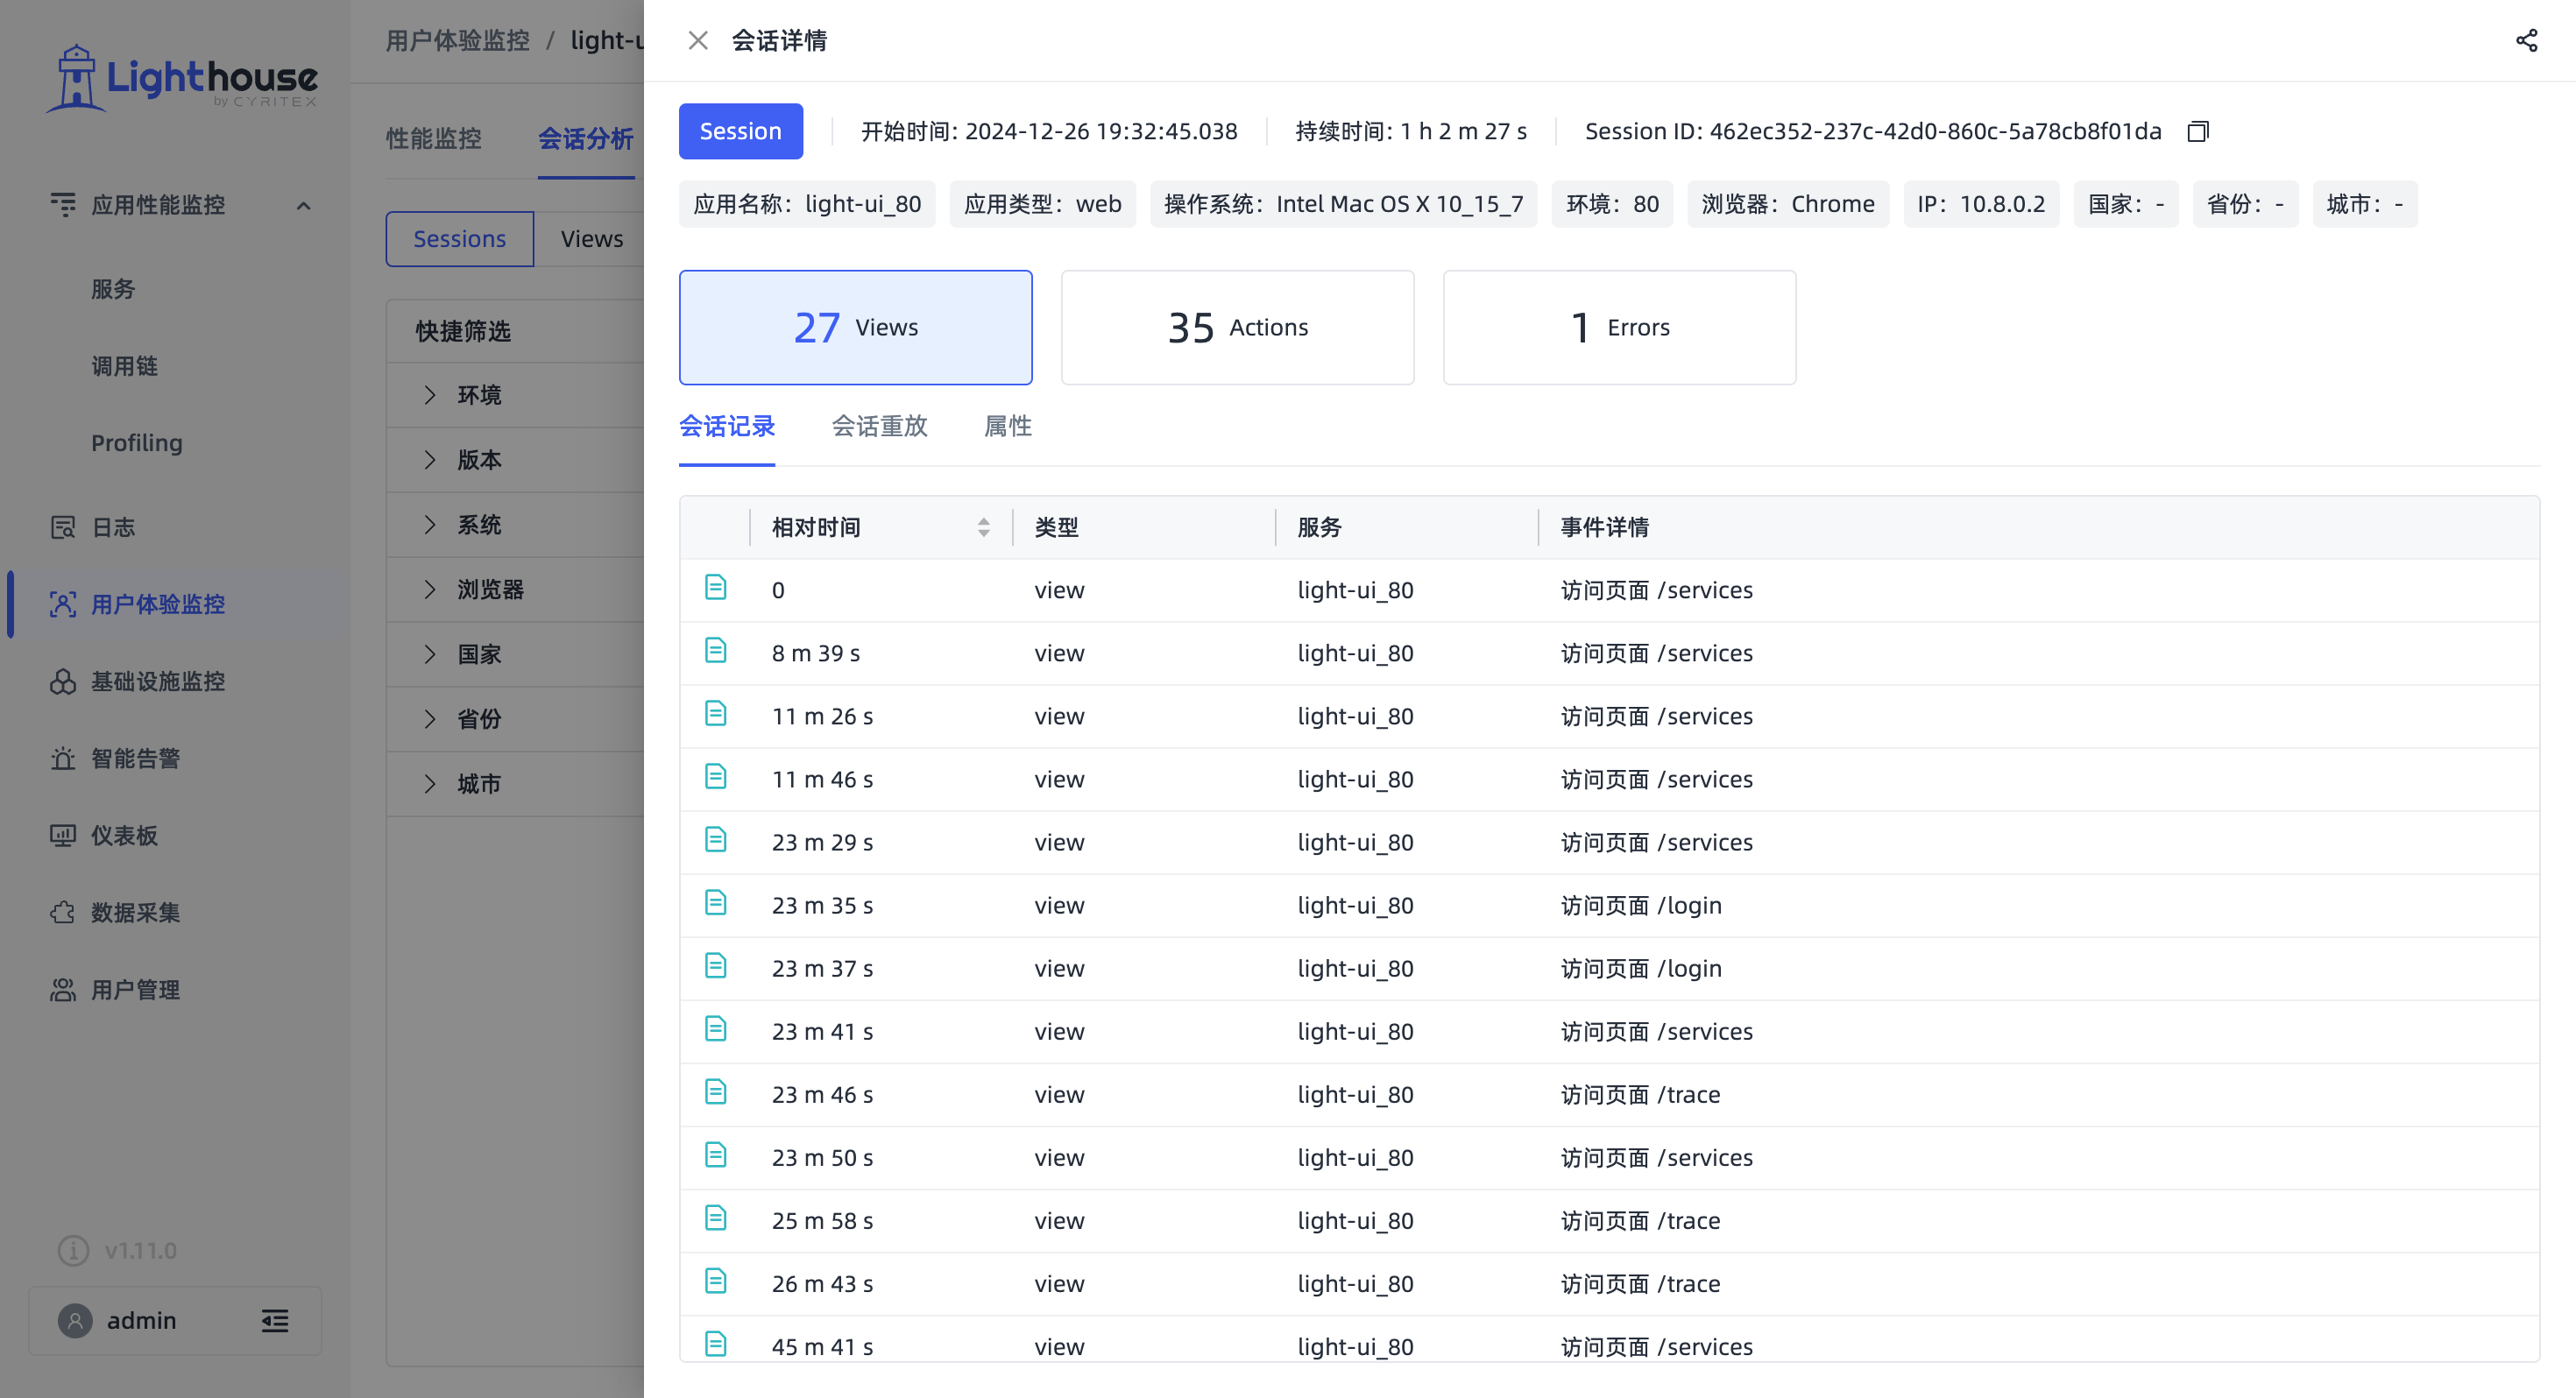
- Added Error type data list and error detail page in "Session Analysis" module.
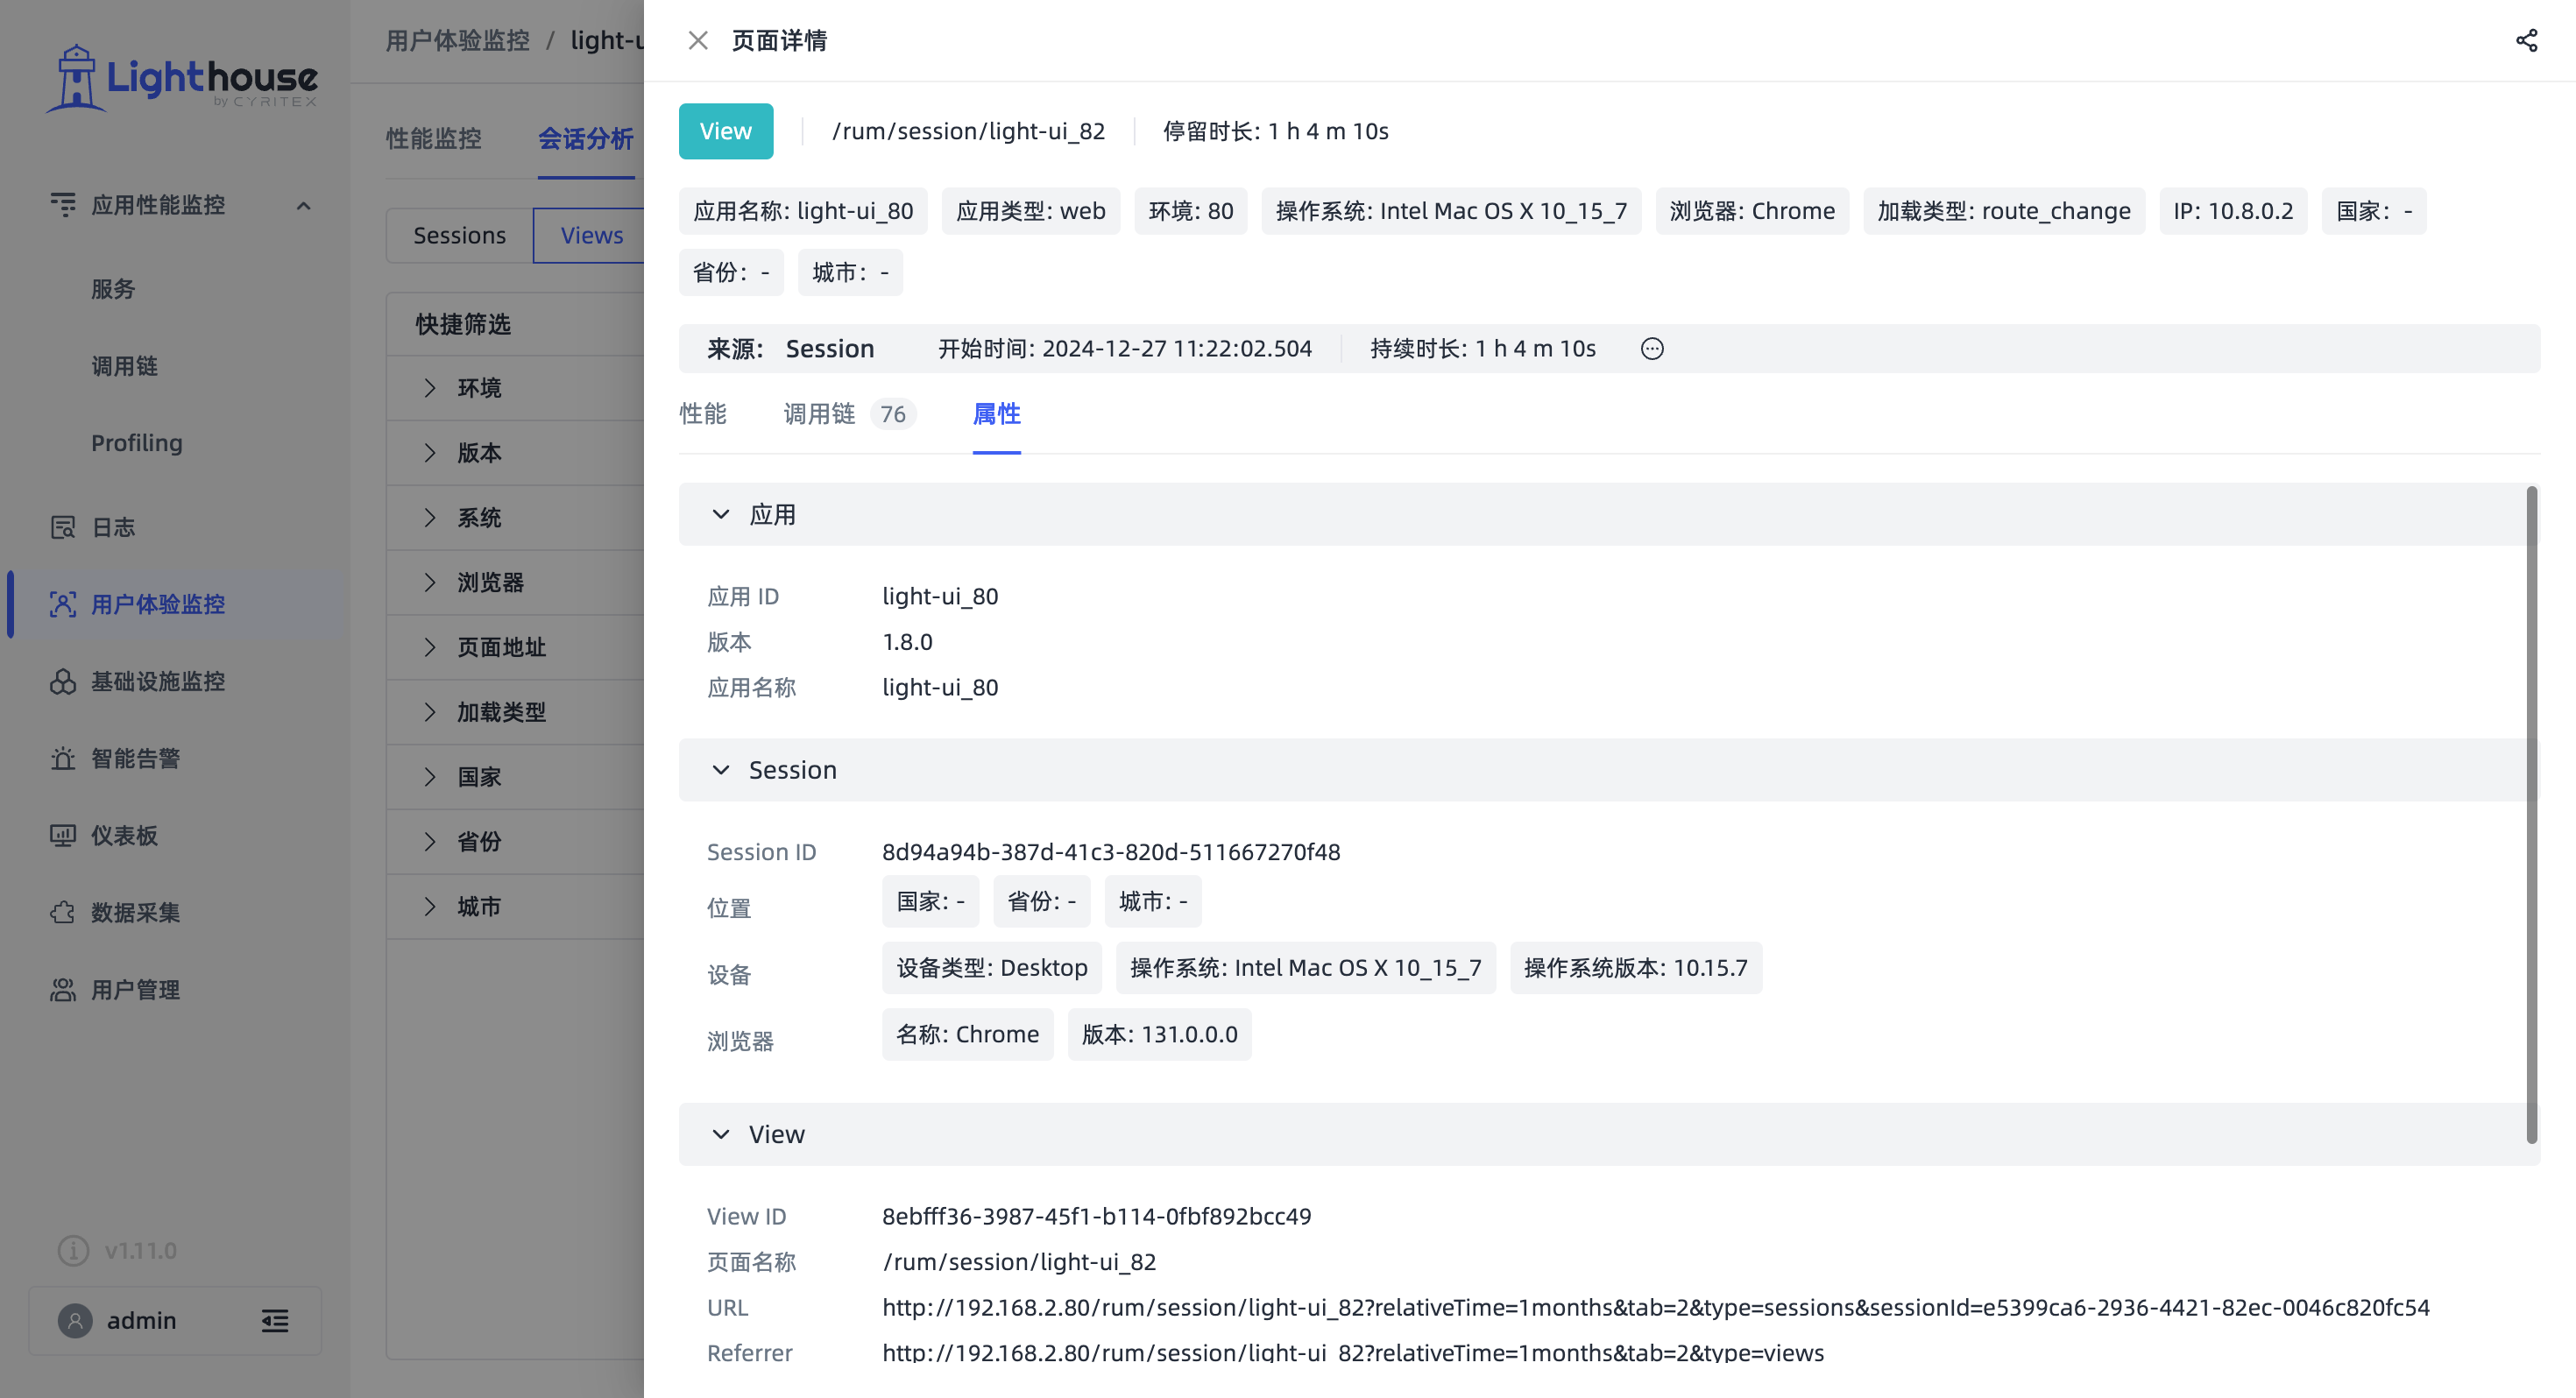
- Added "Properties" tab in various detail pages to display related field information.
- Added event type statistics and quick filtering in Session detail page's session records.
- Added IP field display in Session and View detail pages.
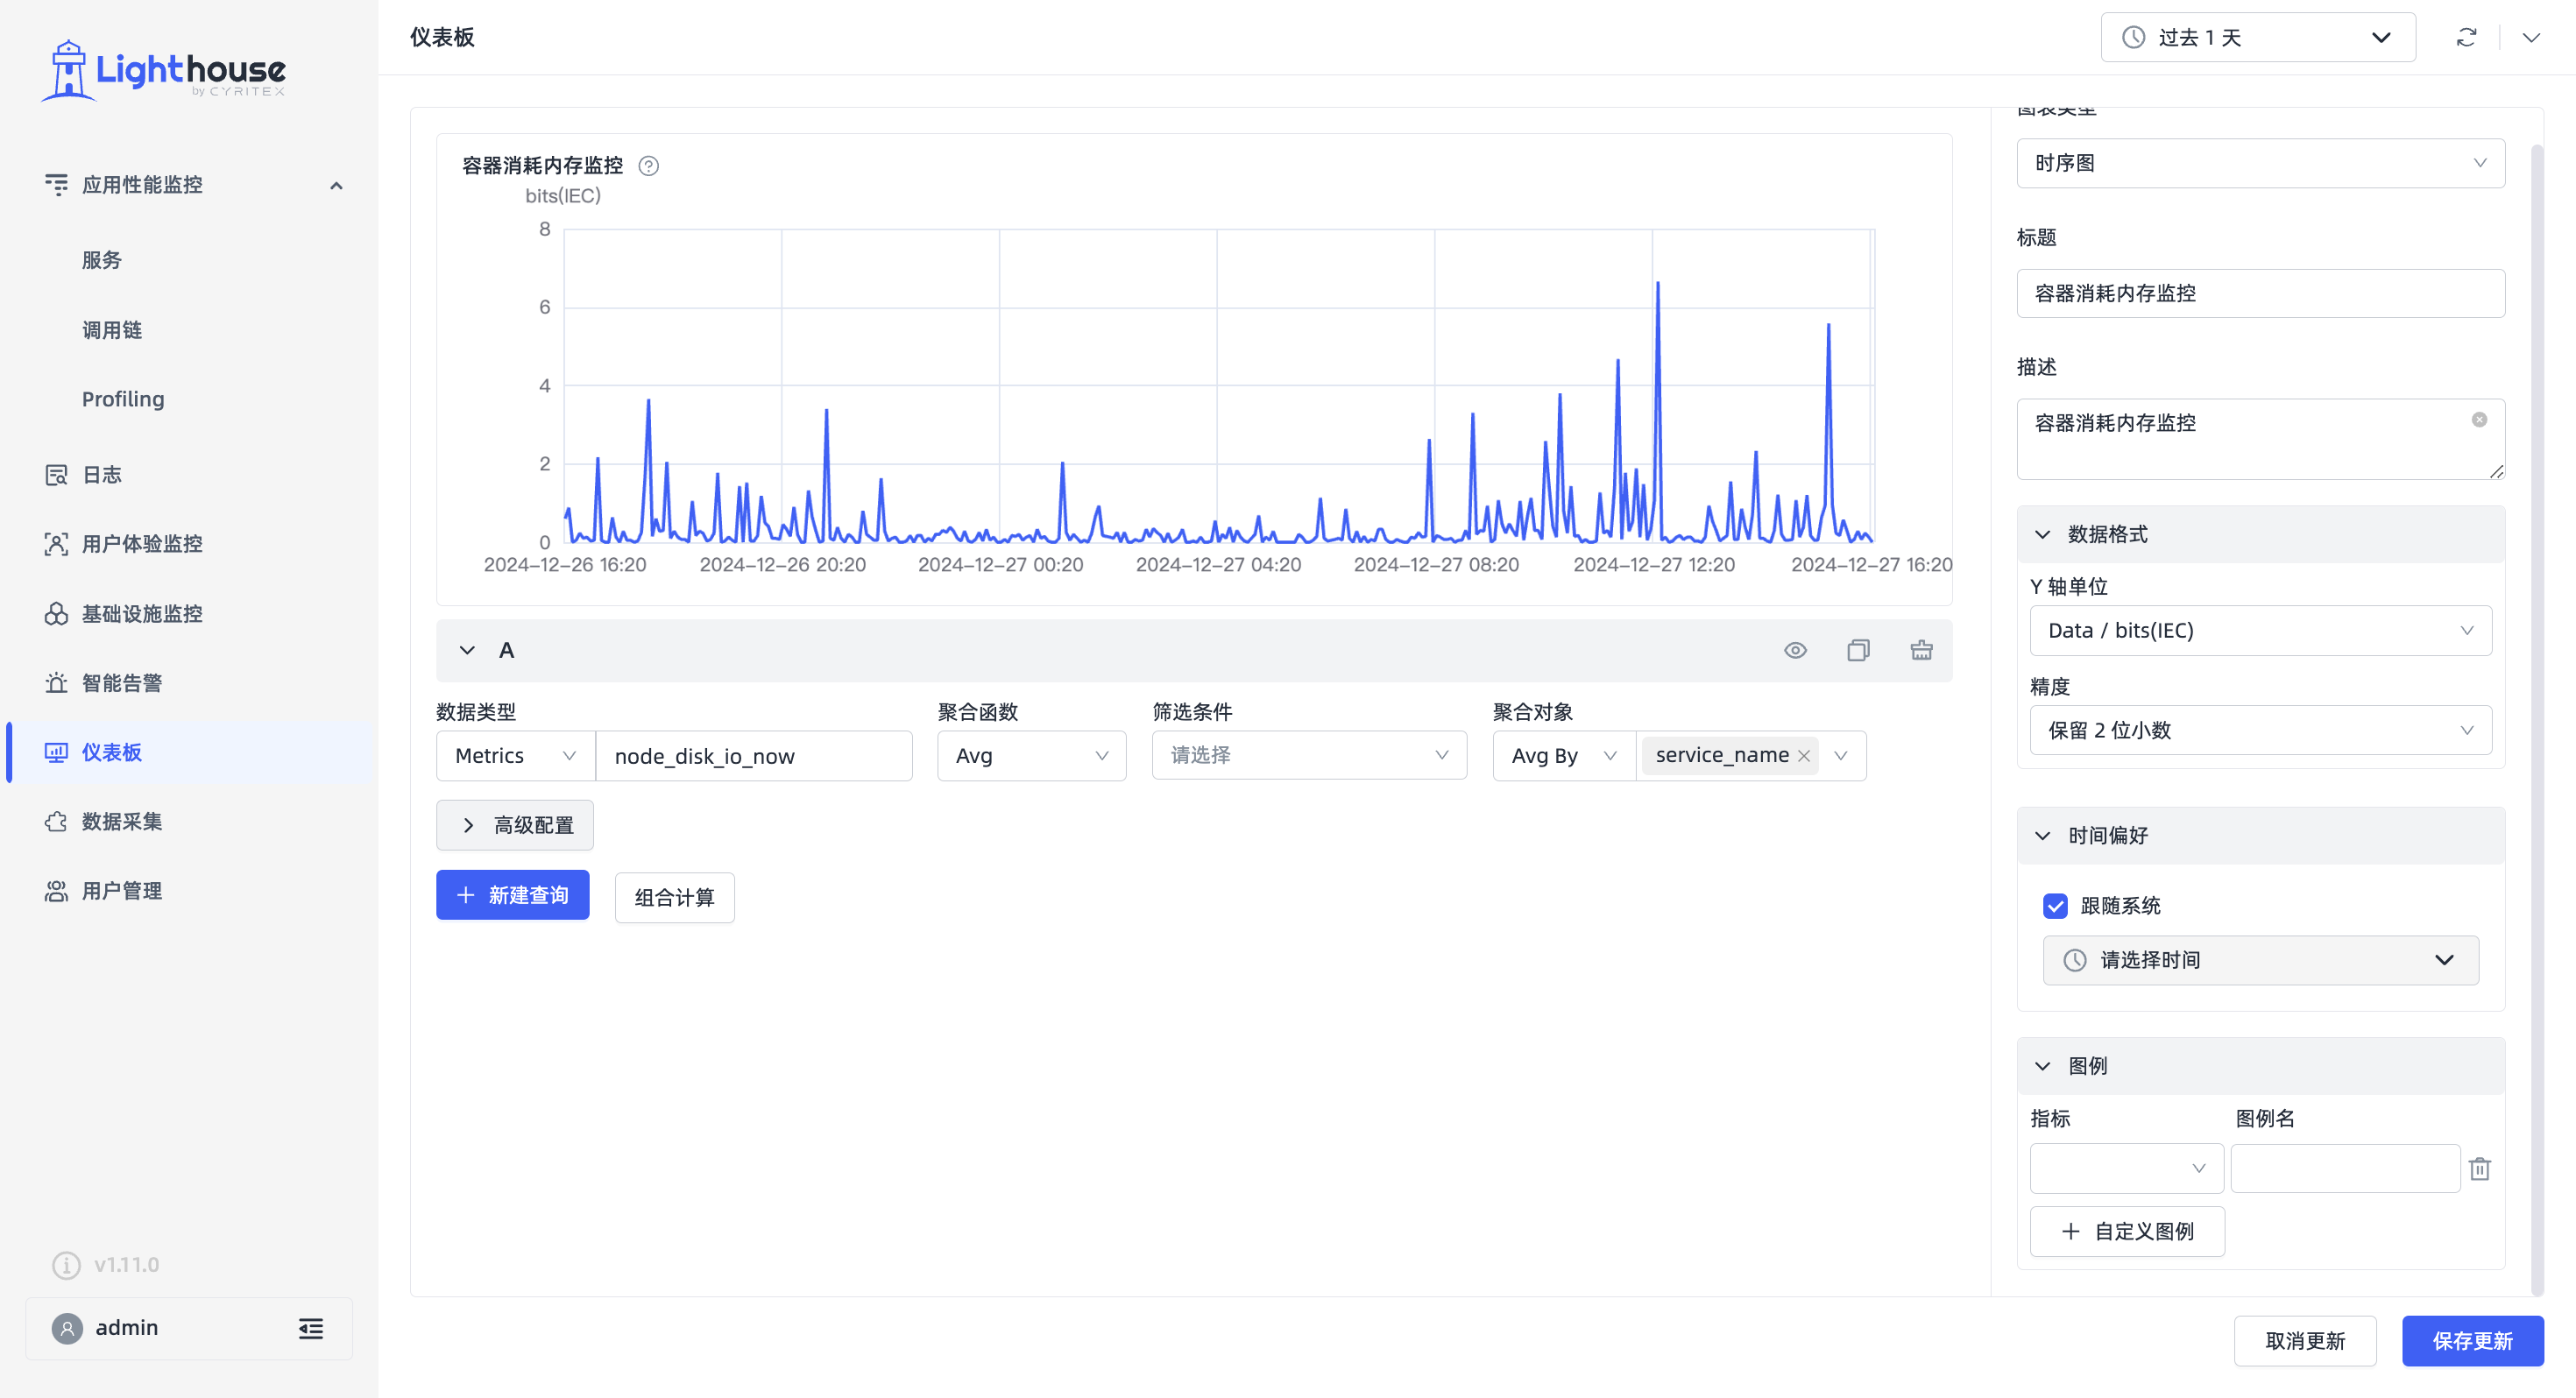
- Added data format and time preference features in chart editing for more customization options:
- Data Format: Customize units and data precision
- Time Preference: Follow global timeline by default, with option for individual chart time settings
- Added count statistics across multiple modules for intuitive data volume display.
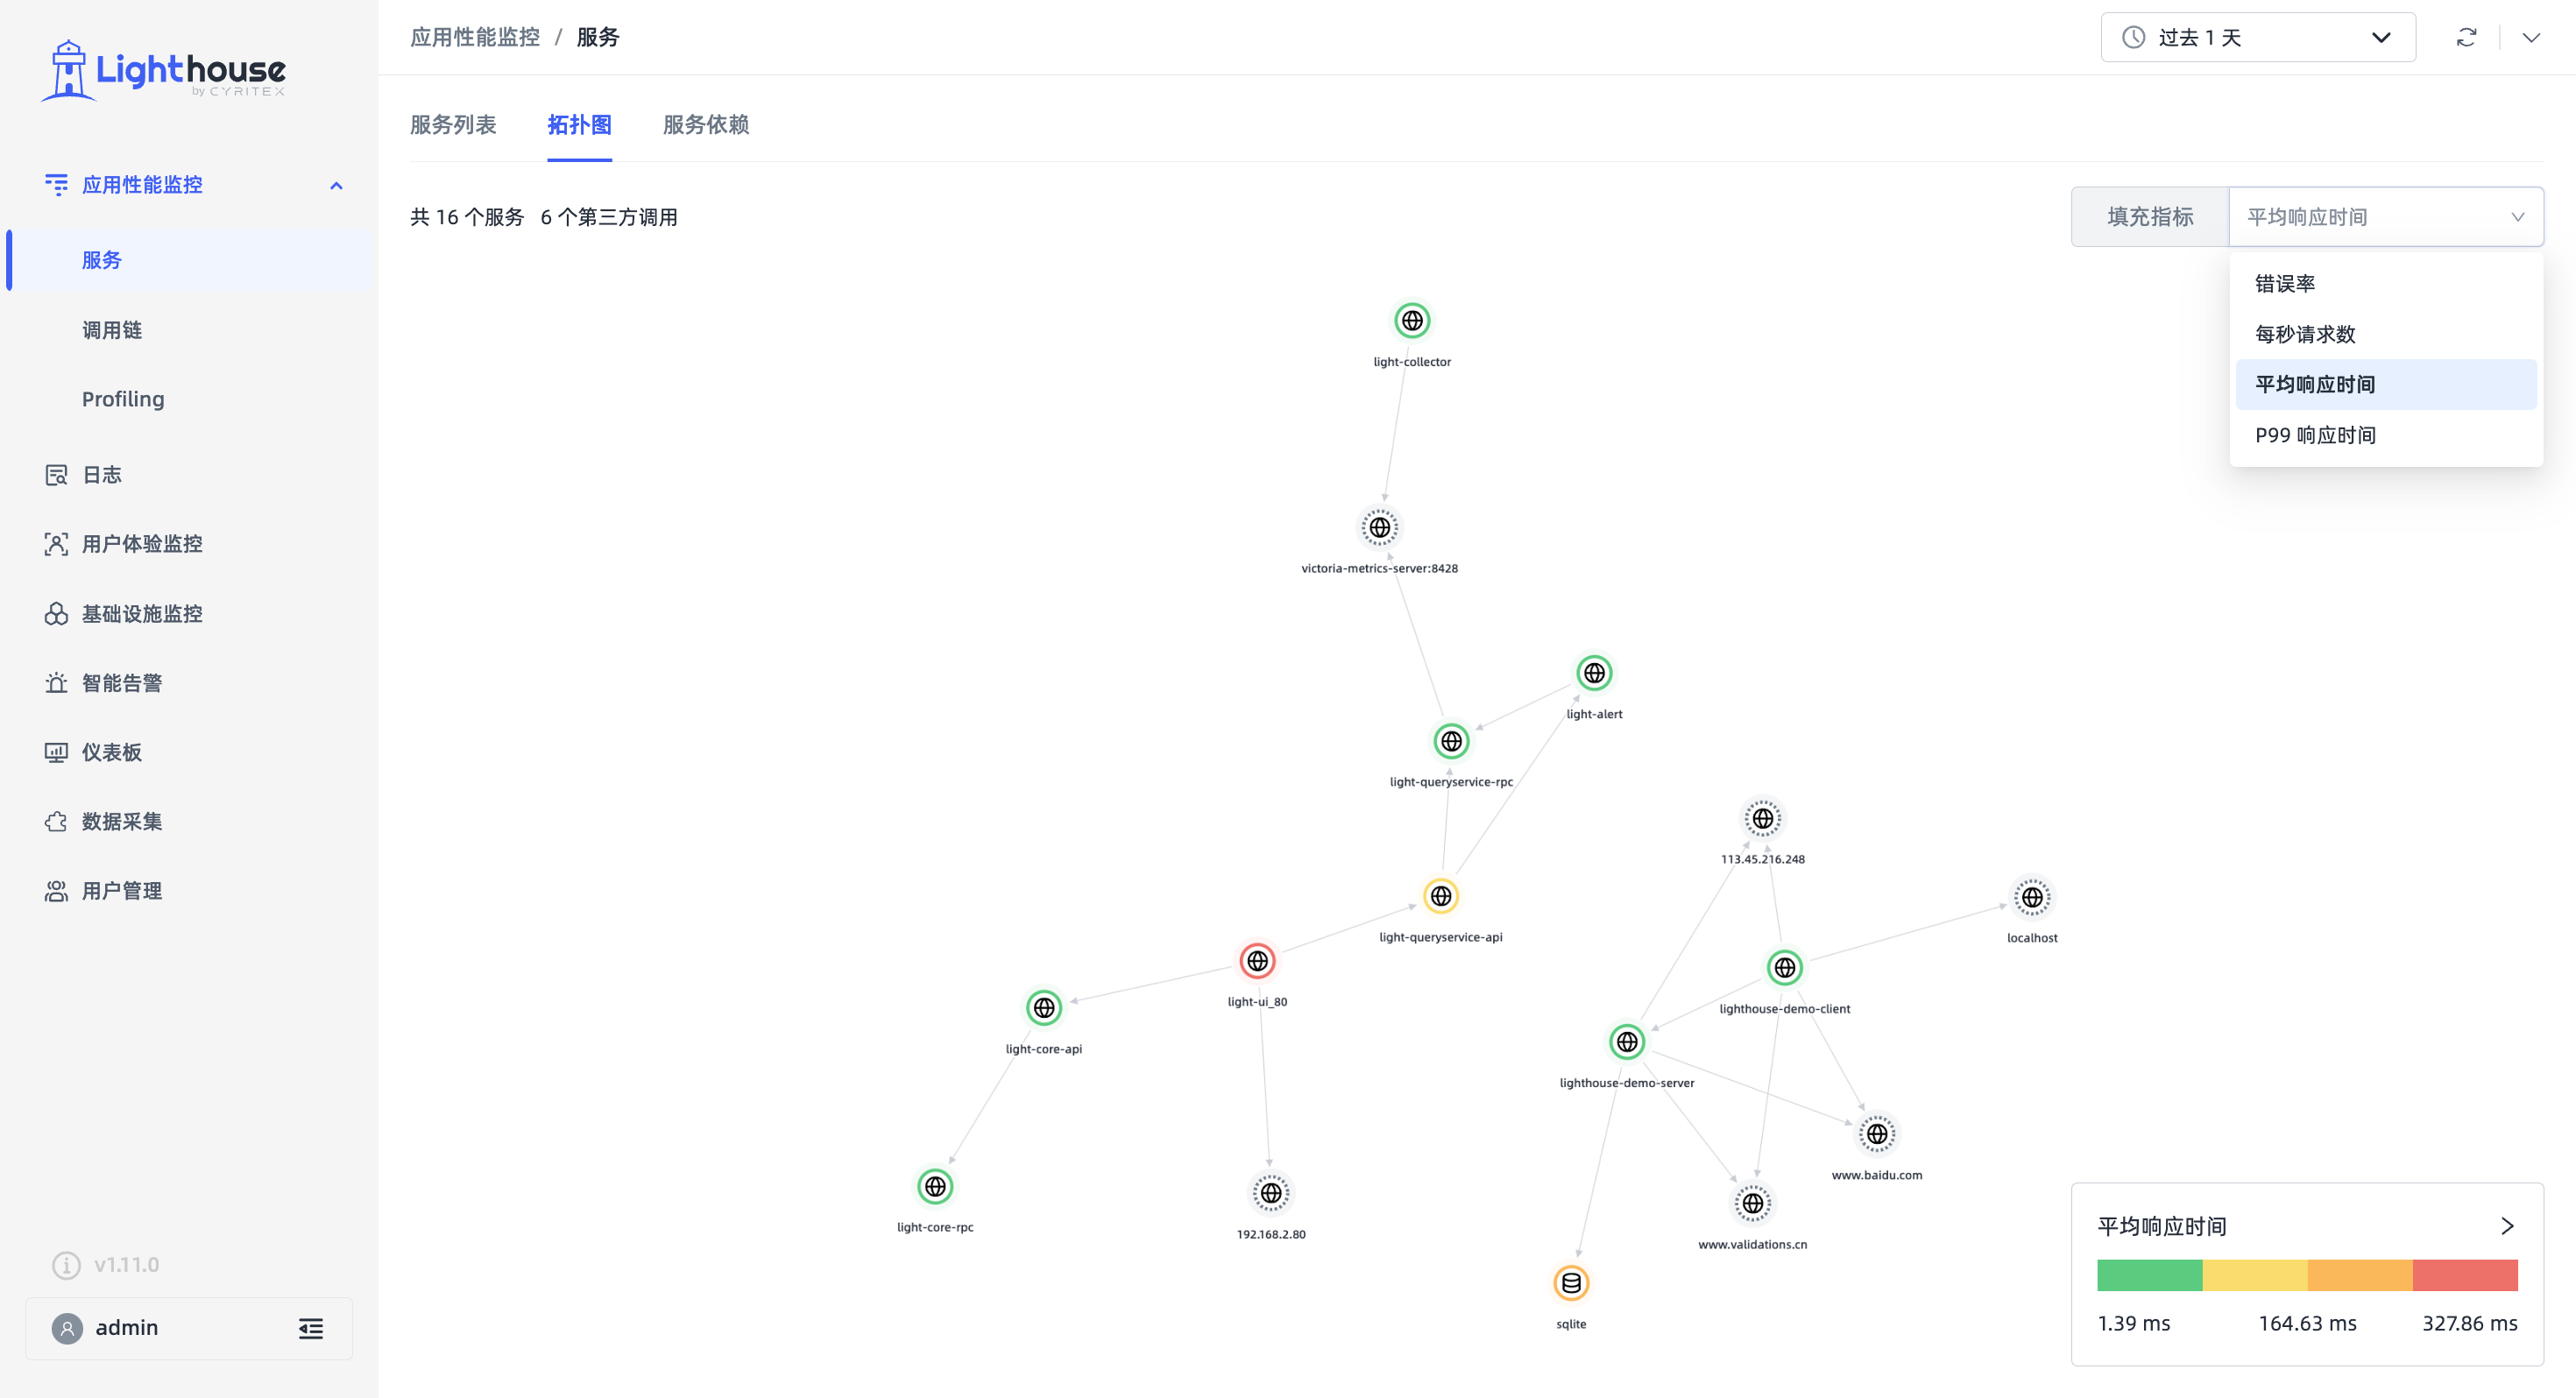
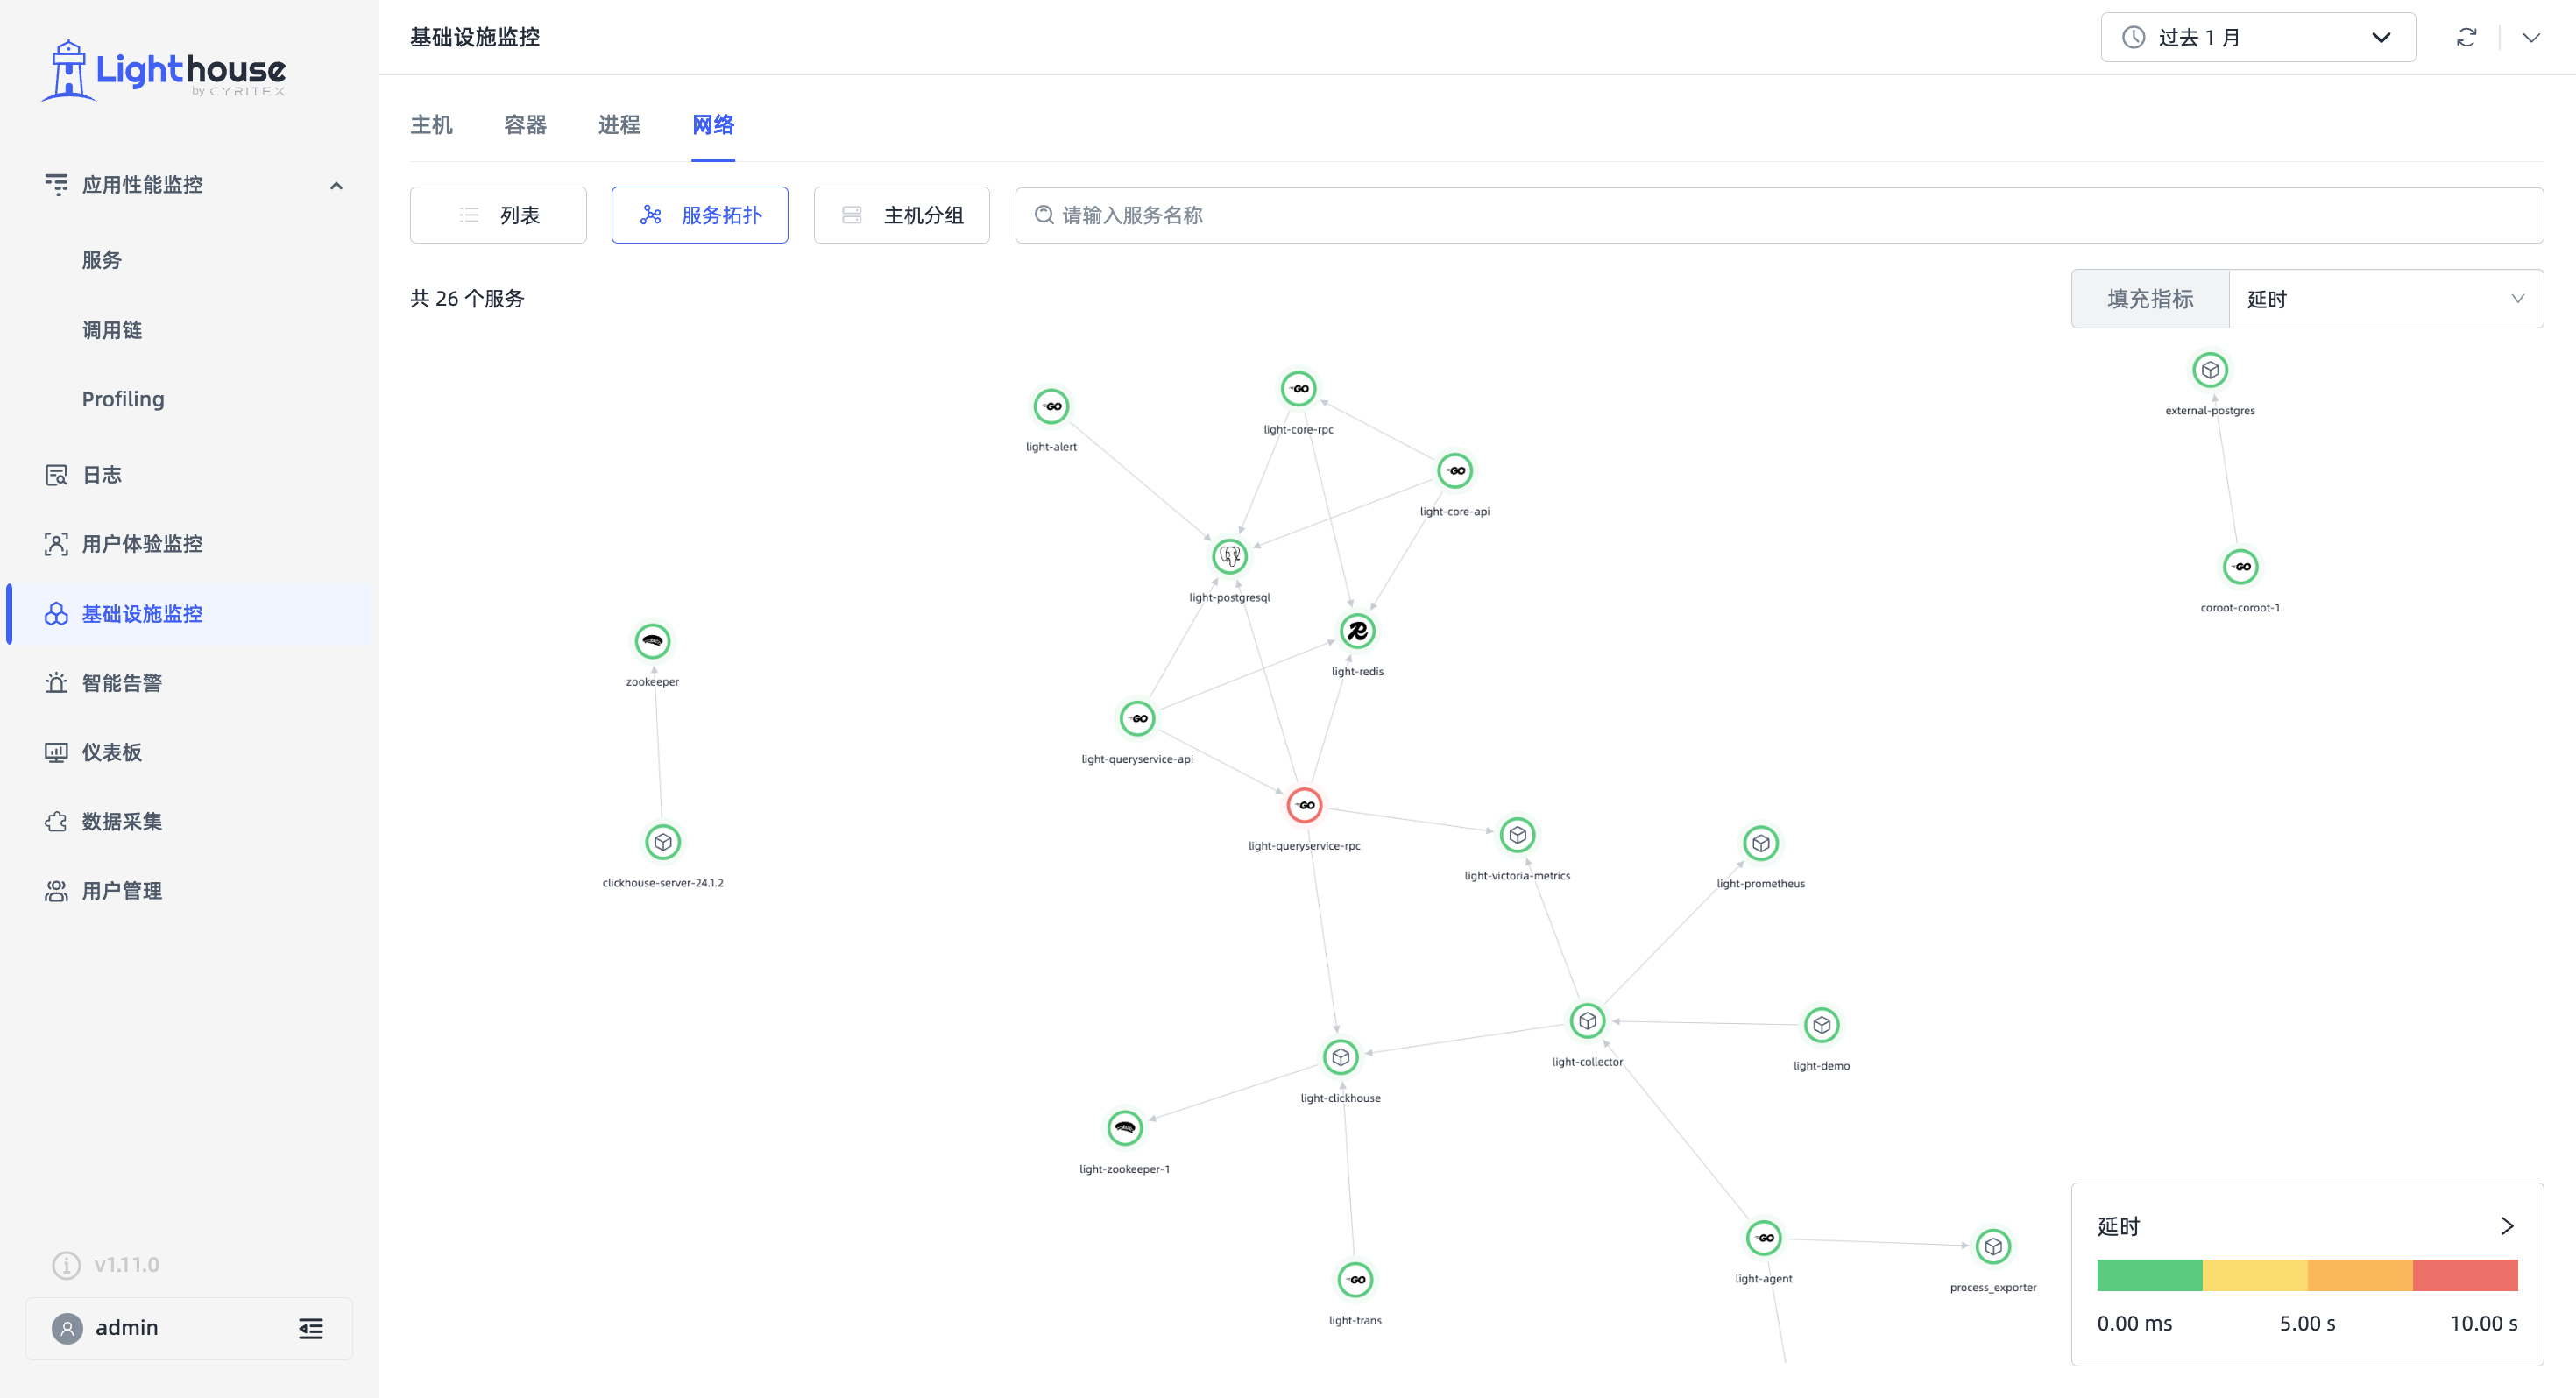
- Added support for different performance metric fills in topology graphs for "Application Performance Monitoring - Services" and "Infrastructure Monitoring - Network" modules.
- Added new documentation: Collecting Go APM Data via Operator
Improvements
- Enhanced third-party call service relationship topology display.
- Improved error span display in trace flame graphs.
- Optimized distance between services in topology graphs for clearer display with multiple services.
- RUM: Added play/pause functionality to animation position clicks in session replay player.
- LOG: Optimized log level color identification logic for more reasonable coloring.
- ITIM: Enhanced instance highlighting in network local topology graphs.
- Dashboard: Improved legend configuration for individual metric customization.
Bug Fixes
- Fixed duplicate data loading in APM service list scrolling.
- Fixed key operation adjustment failure in APM detail page.
- Fixed occasional loading anomalies when clicking APM service list.
- Fixed single service drag issue with long press in APM topology graph.
- Fixed time selection not taking effect after enlarging dashboard charts.
- Fixed data display errors in RUM error analysis.
- Fixed log level coloring issues.
- Fixed alert record detail chart anomalies.
- Fixed ineffective time switch in alert record details.
- Fixed error prompt when clicking "Account Management".
- Fixed occasional upstream/downstream view issues in "Network - Topology".
- Fixed flame graph right boundary alignment in Profiling detail page.
