.NET 数据采集
概述
- 本页将向您展示如何使用 OpenTelemetry .NET 自动检测。
- 您将学习如何自动检测一个简单的 .NET 应用程序,使其能够向可观性性平台发送
traces、metrics和logs数据。
先决条件
确保您已在本地安装以下内容:
- .NET SDK 6+
示例应用程序
以下示例使用基本的 ASP.NET Core Minimal API 应用程序。如果您没有使用 ASP.NET Core,也没关系 — 您仍然可以使用 OpenTelemetry .NET 自动检测。
创建并启动 HTTP 服务器
首先,在一个名为 dotnet-simple 的新目录中设置环境。在该目录中,执行以下命令:
dotnet new web
在同一目录中,将 Program.cs 的内容替换为以下代码:
using System.Globalization;

var builder = WebApplication.CreateBuilder(args);
var app = builder.Build();

var logger = app.Logger;

int RollDice()
{
    return Random.Shared.Next(1, 7);
}

string HandleRollDice(string? player)
{
    var result = RollDice();

    if (string.IsNullOrEmpty(player))
    {
        logger.LogInformation("匿名玩家正在掷骰子:{result}", result);
    }
    else
    {
        logger.LogInformation("{player} 正在掷骰子:{result}", player, result);
    }

    return result.ToString(CultureInfo.InvariantCulture);
}

app.MapGet("/rolldice/{player?}", HandleRollDice);

app.Run();
在 Properties 子目录中,将 launchSettings.json 的内容替换为以下内容:
{
  "$schema": "http://json.schemastore.org/launchsettings.json",
  "profiles": {
    "http": {
      "commandName": "Project",
      "dotnetRunMessages": true,
      "launchBrowser": true,
      "applicationUrl": "http://localhost:8080",
      "environmentVariables": {
        "ASPNETCORE_ENVIRONMENT": "Development"
      }
    }
  }
}
使用以下命令构建并运行应用程序,然后在网络浏览器中打开 http://localhost:8080/rolldice 以确保其正常工作。
dotnet build
dotnet run
检测
接下来,您将使用 OpenTelemetry .NET 自动检测 在启动时检测应用程序。虽然您可以通过多种方式配置 .NET 自动检测,但以下步骤使用 Unix-shell 或 PowerShell 脚本。
- 从
opentelemetry-dotnet-instrumentation仓库的 Releases 下载安装脚本:
- Unix-shell
- PowerShell
curl -L -O https://github.com/open-telemetry/opentelemetry-dotnet-instrumentation/releases/latest/download/otel-dotnet-auto-install.sh
$module_url = "https://github.com/open-telemetry/opentelemetry-dotnet-instrumentation/releases/latest/download/OpenTelemetry.DotNet.Auto.psm1"
$download_path = Join-Path $env:temp "OpenTelemetry.DotNet.Auto.psm1"
Invoke-WebRequest -Uri $module_url -OutFile $download_path -UseBasicParsing
- 执行以下脚本为您的开发环境下载自动检测:
- Unix-shell
- PowerShell
  chmod +x otel-dotnet-auto-install.sh
  ./otel-dotnet-auto-install.sh
   Import-Module $download_path
   Install-OpenTelemetryCore
- 设置并导出指定
导出器的变量,然后使用适合您的 shell/终端环境的表示法执行配置其他必要环境变量的脚本 — 我们展示了 bash shells 和 PowerShell 的表示法:
- Unix-shell
- PowerShell
export OTEL_TRACES_EXPORTER=console,olp \
  OTEL_METRICS_EXPORTER=console,olp \
  OTEL_LOGS_EXPORTER=console,olp \
  OTEL_TRACES_SAMPLER=always_on \
  OTEL_EXPORTER_OTLP_PROTOCOL=grpc \
  OTEL_EXPORTER_OTLP_ENDPOINT=http://127.0.0.1:54317 \
  OTEL_SERVICE_NAME=RollDiceService
. $HOME/.otel-dotnet-auto/instrument.sh
  $env:OTEL_TRACES_EXPORTER="console,olp"
  $env:OTEL_METRICS_EXPORTER="console,olp"
  $env:OTEL_LOGS_EXPORTER="console,olp"
  $env:OTEL_TRACES_SAMPLER="always_on"
  $env:OTEL_EXPORTER_OTLP_PROTOCOL="grpc"
  $env:OTEL_EXPORTER_OTLP_ENDPOINT="http://127.0.0.1:54317"
  $env:OTEL_SERVICE_NAME="RollDiceService"
  Register-OpenTelemetryForCurrentSession -OTelServiceName "RollDiceService"
也可以通过配置 launchSettings.json 来配置:
{
  "$schema": "http://json.schemastore.org/launchsettings.json",
  "profiles": {
    "http": {
      "commandName": "Project",
      "dotnetRunMessages": true,
      "launchBrowser": true,
      "applicationUrl": "http://localhost:8080",
      "environmentVariables": {
        "ASPNETCORE_ENVIRONMENT": "Development",
        "OTEL_TRACES_EXPORTER": "otlp,console",
        "OTEL_METRICS_EXPORTER": "otlp,console",
        "OTEL_LOGS_EXPORTER": "otlp,console",
        "OTEL_EXPORTER_OTLP_ENDPOINT": "http://127.0.0.1:54317",
        "OTEL_EXPORTER_OTLP_PROTOCOL": "grpc",
        "OTEL_TRACES_SAMPLER": "parentbased_always_on",
        "OTEL_DOTNET_AUTO_TRACES_ENABLED": "true",
        "OTEL_SERVICE_NAME": "RollDiceService"
      }
    }
  }
}
- 再次运行您的应用程序:
dotnet run
注意 dotnet run 的输出。
- 从另一个终端,使用
curl发送请求:
curl localhost:8080/rolldice
- 大约 30 秒后,停止服务器进程。
此时,您应该看到类似这样的服务器和客户端的追踪和日志输出(为了可��读性,输出已换行):
追踪和日志
LogRecord.Timestamp:               2025-01-23T08:47:05.7333843Z
LogRecord.TraceId:                 76888dd402a42635678297d9d84165df
LogRecord.SpanId:                  0b866228a82a7d57
LogRecord.TraceFlags:              Recorded
LogRecord.CategoryName:            instrumentation
LogRecord.Severity:                Info
LogRecord.SeverityText:            Information
LogRecord.Body:                    {player} 正在掷骰子:{result}
LogRecord.Attributes (Key:Value):
    player: 2
    result: 2
    OriginalFormat (a.k.a Body): {player} 正在掷骰子:{result}

Resource associated with LogRecord:
os.type: linux
os.description: Rocky Linux 9.4 (Blue Onyx)
os.build_id: 5.14.0-427.16.1.el9_4.x86_64
os.name: Rocky Linux
os.version: 9.4
host.name: obs-otel
host.id: 37af5d4f18d94ef89b943d96288e1087
process.owner: root
process.pid: 3723389
process.runtime.description: .NET 8.0.12
process.runtime.name: .NET
process.runtime.version: 8.0.12
container.id: 147
telemetry.distro.name: opentelemetry-dotnet-instrumentation
telemetry.distro.version: 1.9.0
telemetry.sdk.name: opentelemetry
telemetry.sdk.language: dotnet
telemetry.sdk.version: 1.9.0
service.name: RollDiceService

info: instrumentation[0]
      2 正在掷骰子:2
Activity.TraceId:            76888dd402a42635678297d9d84165df
Activity.SpanId:             0b866228a82a7d57
Activity.TraceFlags:         Recorded
Activity.ActivitySourceName: Microsoft.AspNetCore
Activity.DisplayName:        GET /rolldice/{player?}
Activity.Kind:               Server
Activity.StartTime:          2025-01-23T08:47:05.7316772Z
Activity.Duration:           00:00:00.0041243
Activity.Tags:
    server.address: localhost
    server.port: 8080
    http.request.method: GET
    url.scheme: http
    url.path: /rolldice/2
    network.protocol.version: 1.1
    user_agent.original: Mozilla/5.0 (Windows NT 10.0; Win64; x64) AppleWebKit/537.36 (KHTML, like Gecko) Chrome/131.0.0.0 Safari/537.36
    http.route: /rolldice/{player?}
    http.response.status_code: 200
Resource associated with Activity:
    os.type: linux
    os.description: Rocky Linux 9.4 (Blue Onyx)
    os.build_id: 5.14.0-427.16.1.el9_4.x86_64
    os.name: Rocky Linux
    os.version: 9.4
    host.name: obs-otel
    host.id: 37af5d4f18d94ef89b943d96288e1087
    process.owner: root
    process.pid: 3723389
    process.runtime.description: .NET 8.0.12
    process.runtime.name: .NET
    process.runtime.version: 8.0.12
    container.id: 147
    telemetry.distro.name: opentelemetry-dotnet-instrumentation
    telemetry.distro.version: 1.9.0
    telemetry.sdk.name: opentelemetry
    telemetry.sdk.language: dotnet
    telemetry.sdk.version: 1.9.0
    service.name: RollDiceService
同时,当停止服务器时,您应该看到所有收集的指标的输出(显示示例摘录):
指标
Metric Name: http.client.open_connections, Number of outbound HTTP connections that are currently active or idle on the client., Unit: {connection}, Meter: System.Net.Http
(2025-01-23T07:13:16.6679073Z, 2025-01-23T08:42:52.1409173Z] http.connection.state: idle network.protocol.version: 2 server.address: 192.168.2.81 server.port: 4317 url.scheme: http LongSumNonMonotonic
Value: 2
(2025-01-23T07:13:16.6679073Z, 2025-01-23T08:42:52.1409173Z] http.connection.state: active network.protocol.version: 2 server.address: 192.168.2.81 server.port: 4317 url.scheme: http LongSumNonMonotonic
Value: 0

Metric Name: http.client.connection.duration, The duration of successfully established outbound HTTP connections., Unit: s, Meter: System.Net.Http
(2025-01-23T07:13:16.6682039Z, 2025-01-23T08:42:52.1409187Z] network.protocol.version: 2 server.address: 192.168.2.81 server.port: 4317 url.scheme: http Histogram
Value: Sum: 299.95599999999996 Count: 4 Min: 74.948 Max: 75.003
(-Infinity,0.01]:0
(0.01,0.02]:0
(0.02,0.05]:0
(0.05,0.1]:0
(0.1,0.2]:0
(0.2,0.5]:0
(0.5,1]:0
(1,2]:0
(2,5]:0
(5,10]:0
(10,30]:0
(30,60]:0
(60,120]:4
(120,300]:0
(300,+Infinity]:0
f:\data\WeChat Files\WeChat Files\wxid_9udz7ozd2wzz12\FileStorage\Temp\1737622851484.jpg
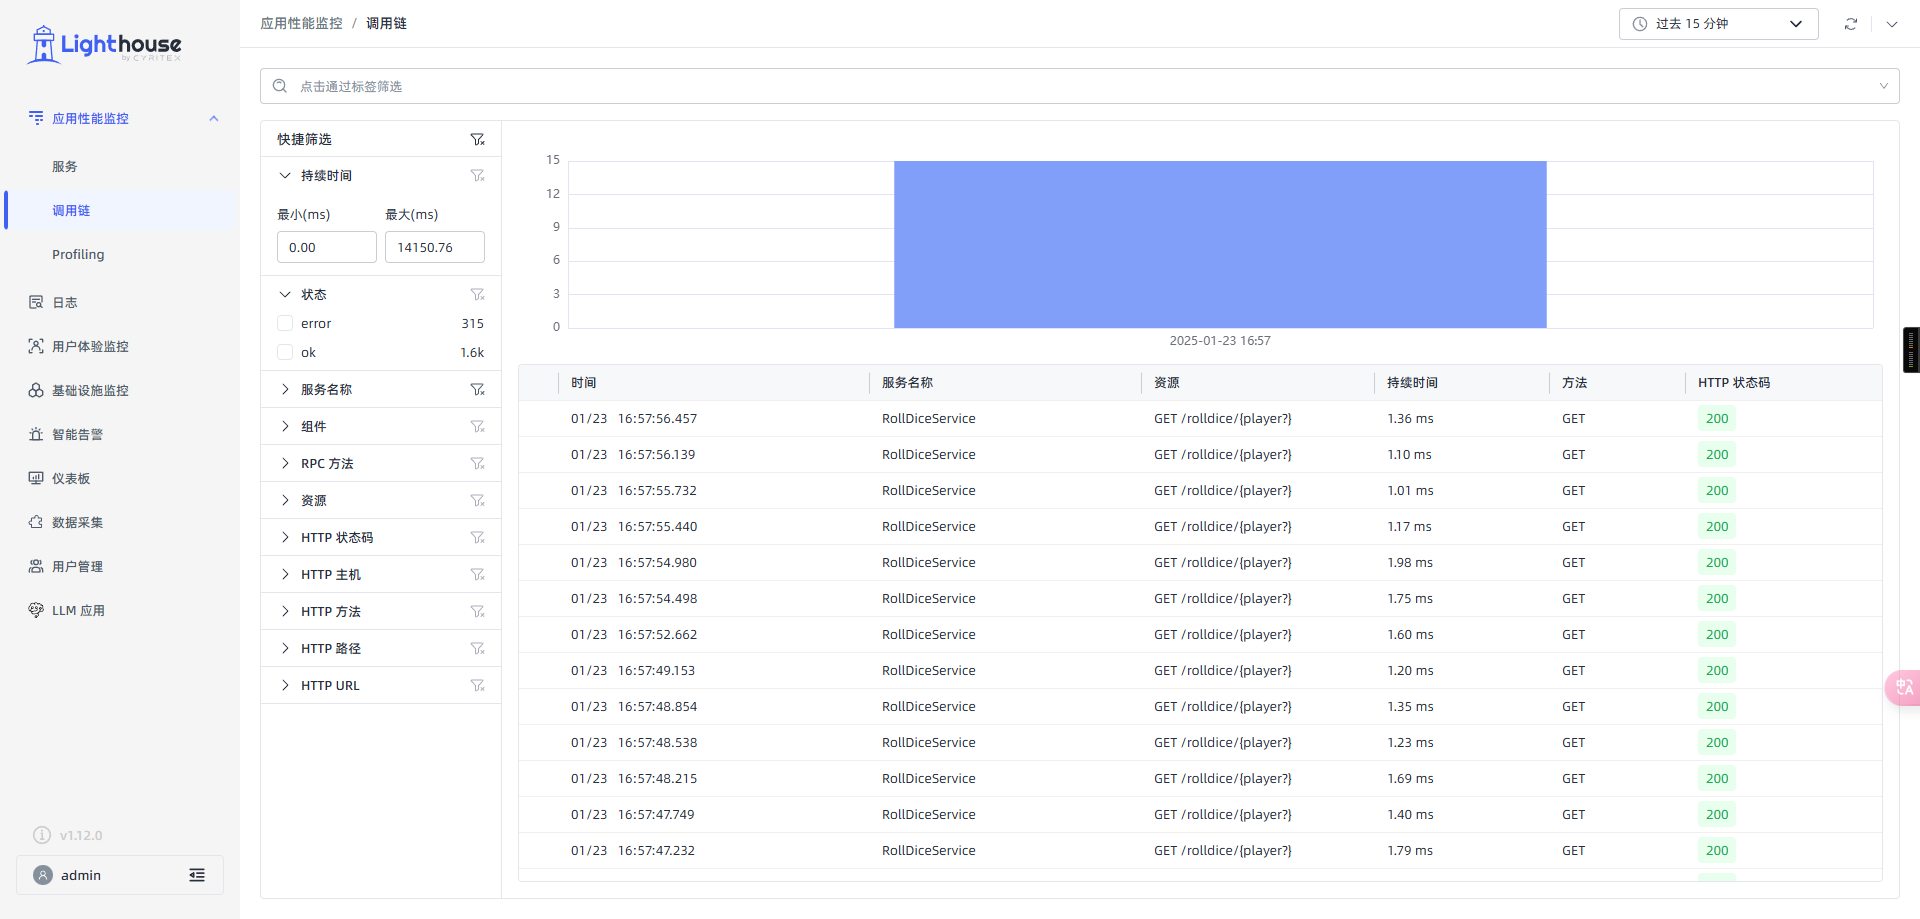
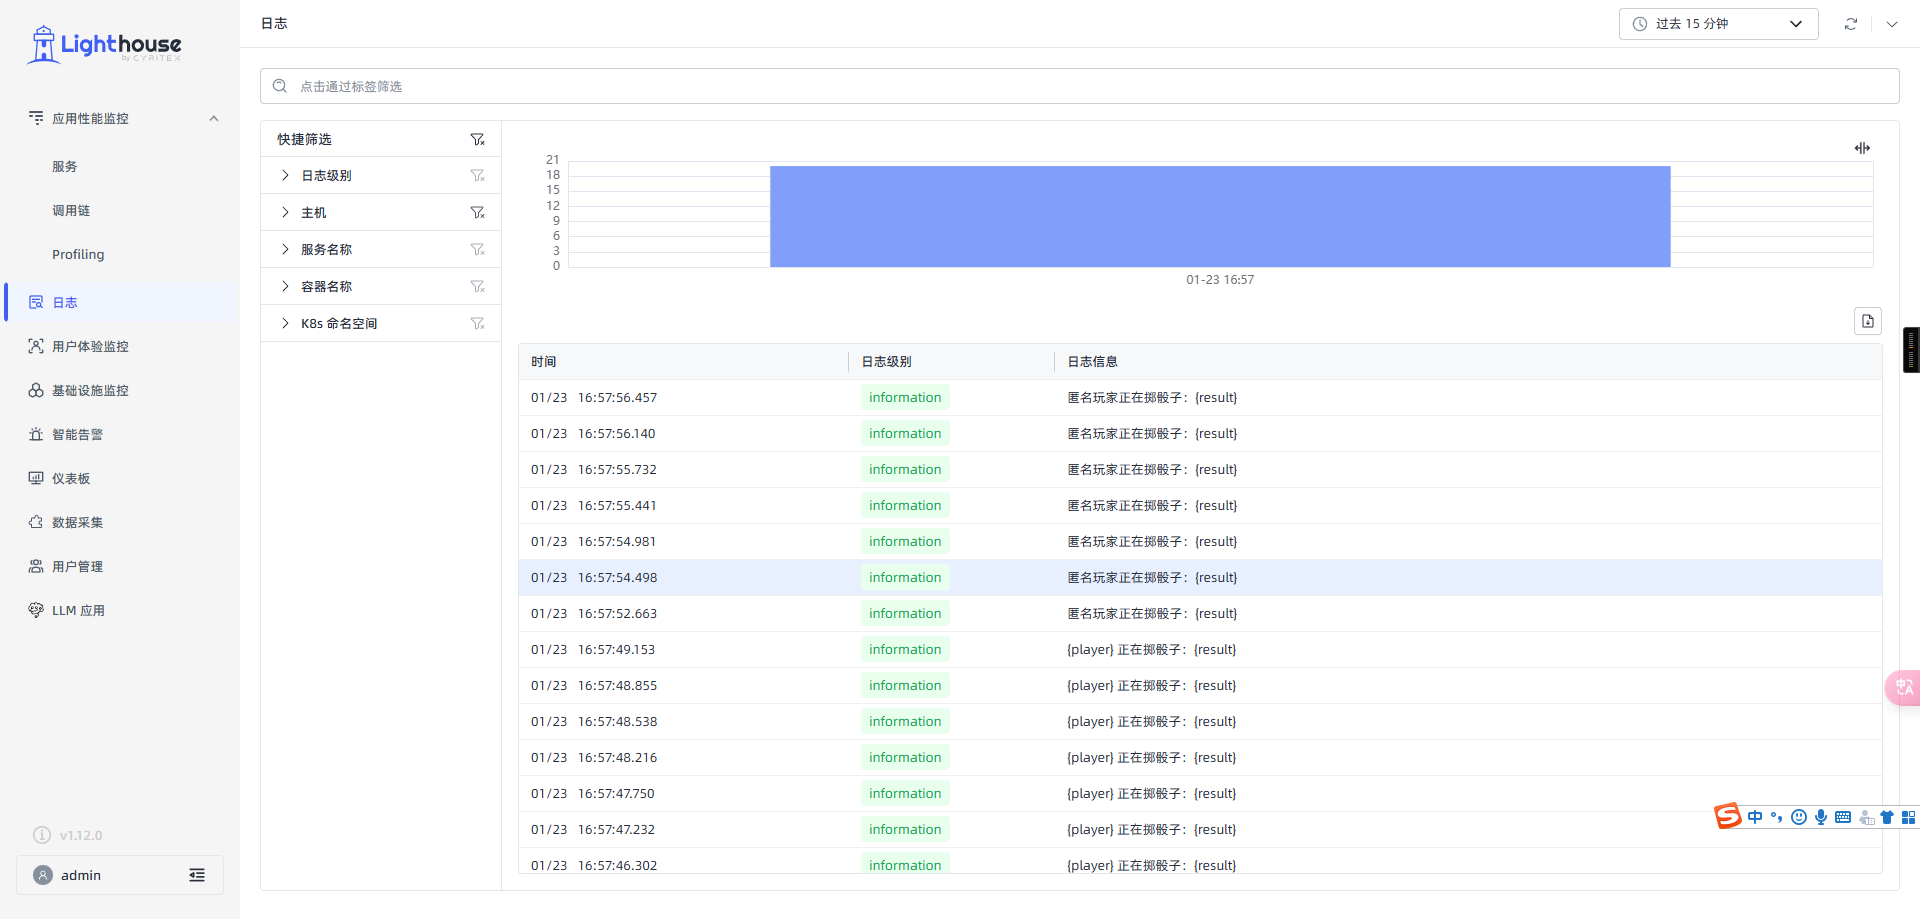
可观测性平台会展示如下:
- traces
- logs
在 Kubernetes 中通过 kubernetes-operator 进行自动检测插桩
前置条件
前置条件
- 需要安装好 light-agent,具体安装步骤查看 Lighthouse 平台【数据采集】
- 区分 light-agent 是否安装在 Kubernetes 集群中
- 如果 light-agent 安装在 Kubernetes 集群中,在安装 light-agent 的时候,已经将镜像导入到 Kubernetes 可以访问的仓库
- 如果 light-agent 安装在 Kubernetes 集群外,需要将 kube-state-metrics 的镜像导入到 Kubernetes 可以访问的仓库。具体步骤查看 Lighthouse 平台【数据采集】-> 【Kubernetes】-> 推送镜像到 Kubernetes 的镜像仓库
- 需要安装好 k8s-operator ,具体安装步骤查看 Kubenetes 安装 k8s-operator
1. 添加 dotnet 的 Automatic Instrumentation
kubectl apply -f automatic-instrumentation-dotnet.yaml
automatic-instrumentation-dotnet.yaml
apiVersion: opentelemetry.io/v1alpha1
kind: Instrumentation
metadata:
  name: auto-instr
  namespace: default
spec:
  exporter:
    endpoint: http://light-agent.light-agent.svc.cluster.local:54318
  propagators:
    - tracecontext
    - baggage
    - b3
  sampler:
    type: parentbased_traceidratio
    argument: "1"
  dotnet:
    env:
      - name: OTEL_DOTNET_AUTO_TRACES_GRPCNETCLIENT_INSTRUMENTATION_ENABLED
    value: false
      - name: OTEL_DOTNET_AUTO_METRICS_PROCESS_INSTRUMENTATION_ENABLED
    value: false
2. 启动 dotnet Demo
kubectl apply -f dotnet-demo.yaml
dotnet-demo.yaml
apiVersion: apps/v1
kind: Deployment
metadata:
  name: dotnet-app
  namespace: default
spec:
  replicas: 1
  selector:
    matchLabels:
      app: dotnet-app
  template:
    metadata:
      labels:
        app: dotnet-app
      annotations:
        instrumentation.opentelemetry.io/inject-dotnet: "true" # 关键配置 是否开启自动检测
    spec:
      containers:
        - name: dotnet-app
          image: your-dotnet-app:latest # 根据实际情况修改
          imagePullPolicy: IfNotPresent
          env:
            - name: OTEL_SERVICE_NAME
              value: "dotnet-app" # 根据实际情况修改
            # .NET 特有的环境变量配置
            - name: CORECLR_ENABLE_PROFILING
              value: "1"
            - name: CORECLR_PROFILER
              value: "{918728DD-259F-4A6A-AC2B-B85E1B658318}"
            # 可选:配置特定的 .NET 插桩设置
            - name: OTEL_DOTNET_AUTO_INSTRUMENTATION_EXCLUDED_ASSEMBLIES
              value: "ExcludedAssembly1,ExcludedAssembly2"
下一步
更多内容: